patch
Plot one or more filled polygonal regions
Syntax
Description
patch(
plots one or more filled polygonal regions using the elements of X,Y,C)X and
Y as the coordinates for each vertex. patch connects the
vertices in the order that you specify them. To create one polygon, specify
X and Y as vectors. To create multiple polygons, specify
X and Y as matrices where each column corresponds to a
polygon. C determines the polygon colors.
patch('Faces', creates
one or more polygons where F,'Vertices',V)V specifies vertex values
and F defines which vertices to connect. Specifying
only unique vertices and their connection matrix can reduce the size
of the data when there are many polygons. Specify one vertex per row
in V. To create one polygon, specify F as
a vector. To create multiple polygons, specify F as
a matrix with one row per polygon. Each face does not have to have
the same number of vertices. To specify different numbers of vertices,
pad F with NaN values.
patch(___, creates
polygons and specifies one or more patch properties using name-value
pair arguments. A patch is the object that contains the data for all
of the polygons created. You can specify patch properties with any
of the input argument combinations in the previous syntaxes. For example, Name,Value)'LineWidth',2 sets
the outline width for all of the polygons to 2 points.
patch( creates
the patch in the axes specified by ax,___)ax instead of
in the current axes (gca). The option ax can
precede any of the input argument combinations in the previous syntaxes.
p = patch(___)p to
query and modify properties of the patch object after it is created.
For a list of properties and descriptions, see Patch Properties.
Examples
Specifying Coordinates
Create a single polygon by specifying the (x,y) coordinates of each vertex. Then, add two more polygons to the figure.
Create a red square with vertices at (0,0), (1,0), (1,1), and (0,1). Specify x as the x-coordinates of the vertices and y as the y-coordinates. patch automatically connects the last (x,y) coordinate with the first (x,y) coordinate.
x = [0 1 1 0];
y = [0 0 1 1];
patch(x,y,'red')
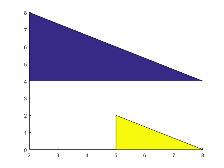
Create two polygons by specifying x and y as two-column matrices. Each column defines the coordinates for one of the polygons. patch adds the polygons to the current axes without clearing the axes.
x2 = [2 5; 2 5; 8 8];
y2 = [4 0; 8 2; 4 0];
patch(x2,y2,'green')
Specifying Faces and Vertices
Create a single polygon by specifying the coordinates of each unique vertex and a matrix that defines how to connect them. Then, add two more polygons to the figure.
Create a red square with corners at (0,0), (1,0), (1,1), and (0,1). Specify v so that each row defines the (x,y) coordinates for one vertex. Then, specify f as the vertices to connect. Set the color by specifying the FaceColor property.
v = [0 0; 1 0; 1 1; 0 1];
f = [1 2 3 4];
patch('Faces',f,'Vertices',v,'FaceColor','red')

Create two polygons by specifying f as a two-row matrix. Each row defines the face for one patch.
v2 = [2 4; 2 8; 8 4; 5 0; 5 2; 8 0];
f2 = [1 2 3;
    4 5 6];
patch('Faces',f2,'Vertices',v2,'FaceColor','green')
Different Polygon Face Colors
Create two polygons and use a different color for each polygon face. Use a colorbar to show how the colors map into the colormap.
Create the polygons using matrices x and y. Specify c as an column vector with two elements since there are two polygon faces, and add a colorbar.
x = [2 5; 2 5; 8 8];
y = [4 0; 8 2; 4 0];
c = [0; 1];
figure
patch(x,y,c)
colorbar

Alternatively, you can get the same result when using f and v instead. When you create the polygons, set FaceVertexCData to a column vector with two elements since there are two polygon faces. Set FaceColor to 'flat'.
v = [2 4; 2 8; 8 4; 5 0; 5 2; 8 0];
f = [1 2 3; 4 5 6];
col = [0; 1];
figure
patch('Faces',f,'Vertices',v,'FaceVertexCData',col,'FaceColor','flat');
colorbar

Interpolated Polygon Face Colors
Interpolate colors across polygon faces by specifying a color at each polygon vertex, and use a colorbar to show how the colors map into the colormap.
Create the polygons using matrices x and y. Specify c as a matrix the same size as x and y defining one color per vertex, and add a colorbar.
x = [2 5; 2 5; 8 8];
y = [4 0; 8 2; 4 0];
c = [0 3; 6 4; 4 6];
figure
patch(x,y,c)
colorbar

Alternatively, you can get the same result using f and v instead. When you create the polygons, set FaceVertexCData to a column vector with one value per vertex and set FaceColor to 'interp'.
v = [2 4; 2 8; 8 4; 5 0; 5 2; 8 0];
f = [1 2 3; 4 5 6];
col = [0; 6; 4; 3; 4; 6];
figure
patch('Faces',f,'Vertices',v,'FaceVertexCData',col,'FaceColor','interp');
colorbar

Polygon Edges Without Faces
Create a polygon with green edges and do not display the face. Then, create a second polygon with a different color for each edge.
v = [0 0; 1 0; 1 1];
f = [1 2 3];
figure
patch('Faces',f,'Vertices',v,...
    'EdgeColor','green','FaceColor','none','LineWidth',2);

Use a different color for each edge by specifying a color for each vertex and setting EdgeColor to 'flat'.
v = [2 0; 3 0; 3 1];
f = [1 2 3];
c = [1 0 0; % red
    0 1 0; % green
    0 0 1]; % blue
patch('Faces',f,'Vertices',v,'FaceVertexCData',c,...
    'EdgeColor','flat','FaceColor','none','LineWidth',2);

Polygons Using Structure
Use a structure to create two polygons. First, create a structure with fields names that match patch property names. Then, use the structure to create the polygons.
clear S
S.Vertices = [2 4; 2 8; 8 4; 5 0; 5 2; 8 0];
S.Faces = [1 2 3; 4 5 6];
S.FaceVertexCData = [0; 1];
S.FaceColor = 'flat';
S.EdgeColor = 'red';
S.LineWidth = 2;
figure
patch(S)

Semitransparent Polygons
Create two semitransparent polygons by setting the FaceAlpha property to a value between 0 and 1.
v1 = [2 4; 2 8; 8 4];
f1 = [1 2 3];
figure
patch('Faces',f1,'Vertices',v1,'FaceColor','red','FaceAlpha',.3);

v2 = [2 4; 2 8; 8 8];
f2 = [1 2 3];
patch('Faces',f2,'Vertices',v2,'FaceColor','blue','FaceAlpha',.5);
![]()
Create Multicolored Line
Create a multicolored line with markers at each vertex. Interpolate the colors and use a colorbar to show how the values map to the colormap.
Create the data. Set the last entry of y to NaN so that patch creates a line instead of a closed polygon. Define a color for each vertex using the y values. The values in c map to colors in the colormap.
x = linspace(1,10,15);
y = sin(x);
y(end) = NaN;
c = y;
Create the line. Show markers at each vertex and set the EdgeColor to 'interp' to interpolate the colors between vertices. Add a colorbar.
figure
patch(x,y,c,'EdgeColor','interp','Marker','o','MarkerFaceColor','flat');
colorbar;

Input Arguments
X — x-coordinates for vertices
vector | matrix
x-coordinates for the vertices, specified in one of these forms:
Vector — Create one polygon.
Matrix — Create
npolygons withmvertices each, where[m,n] = size(X). Each column in the matrix corresponds to one polygon.
If the data does not define closed polygons, then patch closes
the polygons. If the edges of an individual polygon intersect themselves,
the resulting polygons might be partly filled. In that case, it is
better to divide the patch object into smaller polygons.
When you specify X, the patch function
sets the XData property for the patch object to
the same value. The patch object automatically calculates the face
and vertex data and sets the Faces and Vertices properties
to the appropriate values.
Data Types: single | double | int8 | int16 | int32 | int64 | uint8 | uint16 | uint32 | uint64
Y — y-coordinates for vertices
vector | matrix
y-coordinates for the vertices, specified in one of these forms:
Vector — Create one polygon.
Matrix — Create
npolygons withmvertices each, where[m,n] = size(Y). Each column in the matrix corresponds to one polygon.
If the data does not define closed polygons, then patch closes
the polygons. If the edges of an individual polygon intersect themselves,
the resulting polygons might be partly filled. In that case, it is
better to divide the patch object into smaller polygons.
When you specify Y, the patch function
sets the YData property for the patch object to
the same value. The patch object automatically calculates the face
and vertex data and sets the Faces and Vertices properties
to the appropriate values.
Data Types: single | double | int8 | int16 | int32 | int64 | uint8 | uint16 | uint32 | uint64
Z — z-coordinates for vertices
vector | matrix
z-coordinates for the vertices, specified in one of these forms:
Vector — Create one polygon.
Matrix — Create
mpolygons withnvertices each, where[m,n] = size(Z). Each column in the matrix corresponds to one polygon.
When you specify Z, the patch function
sets the ZData property for the patch object to
the same value. The patch object automatically calculates the face
and vertex data and sets the Faces and Vertices properties
to the appropriate values.
Data Types: single | double | int8 | int16 | int32 | int64 | uint8 | uint16 | uint32 | uint64
C — Polygon colors
scalar | vector | matrix | RGB triplet | 'r' | 'g' | 'b' | ...
Polygon colors, specified as a scalar, vector, matrix, or a color name. The format of the input determines whether all polygons have the same color, one color per face, or interpolated face colors.
| Desired Effect | Use One of These Formats | Results |
|---|---|---|
| Single color for all faces |
For an example, see Specifying Coordinates. |
|
| One color per face |
For an example, see Different Polygon Face Colors. |
|
| Interpolated face colors |
For an example, see Interpolated Polygon Face Colors. |
|


An RGB
triplet is a three-element row vector whose elements specify the intensities of the red,
green, and blue components of the color. The intensities must be in the range
[0,1]; for example, [0.4 0.6 0.7]. Alternatively, you
can specify some common colors by name. This table lists the long and short color name options
and the equivalent RGB triplet values.
| Option | Description | Equivalent RGB Triplet |
|---|---|---|
'red' or 'r' | Red | [1 0 0] |
'green' or 'g' | Green | [0 1 0] |
'blue' or 'b' | Blue | [0 0 1] |
'yellow' or 'y' | Yellow | [1 1 0] |
'magenta' or 'm' | Magenta | [1 0 1] |
'cyan' or 'c' | Cyan | [0 1 1] |
'white' or 'w' | White | [1 1 1] |
'black' or 'k' | Black | [0 0 0] |
V — Polygon vertices
two-column or three-column matrix
Polygon vertices, specified in one of these forms:
Two-column matrix — Each row contains the (x,y) coordinates for a vertex.
Three-column matrix — Each row contains the (x,y,Z) coordinates for a vertex.
Specify only unique vertices. You can refer to a vertex more
than once when defining the face definitions in F.
When you specify V, the patch function
sets the Vertices property for the patch object
to the same value. The patch object automatically calculates the coordinate
data and sets the XData, YData,
and ZData to the appropriate values.
Data Types: single | double | int8 | int16 | int32 | int64 | uint8 | uint16 | uint32 | uint64
F — Face definitions
row vector | matrix
Face definitions, specified in one of these forms:
Row vector — Create a single polygon.
Matrix — Create multiple polygons where each row corresponds to a polygon.
For example, this code defines three vertices in V and
creates one polygon by connecting vertex 1 to 2, 2 to 3, and 3 to
1.
V = [1 1; 2 1; 2 2];
F = [1 2 3 1];
patch('Faces',F,'Vertices',V)
When you specify F, the patch function
sets the Faces property for the patch object to
the same value. The patch object automatically calculates the coordinate
data and sets the XData, YData,
and ZData to the appropriate values.
Data Types: single | double | int8 | int16 | int32 | int64 | uint8 | uint16 | uint32 | uint64
S — Patch definition
structure
Patch definition, specified as a structure with fields that correspond patch property names and field values that correspond to patch property values.
ax — Axes object
axes object
Axes object. If you do not specify an axes object, then patch uses
the current axes.
Name-Value Pair Arguments
Specify optional
comma-separated pairs of Name,Value arguments. Name is
the argument name and Value is the corresponding value.
Name must appear inside quotes. You can specify several name and value
pair arguments in any order as
Name1,Value1,...,NameN,ValueN.
patch(x,y,c,'FaceAlpha',.5,'LineStyle',':') creates
semitransparent polygons with dotted edges.The properties listed here are only a subset of patch properties. For a complete list, see Patch Properties.
Face color, specified as 'interp', 'flat' an RGB
triplet, a hexadecimal color code, a color name, or a short name.
To create a different color for each face, specify the CData or
FaceVertexCData property as an array containing one color per
face or one color per vertex. The colors can be interpolated from the colors of the
surrounding vertices of each face, or they can be uniform. For interpolated colors,
specify this property as 'interp'. For uniform colors, specify this
property as 'flat'. If you specify 'flat' and a
different color for each vertex, the color of the first vertex you specify determines
the face color.
To designate a single color for all of the faces, specify this property as an RGB triplet, a hexadecimal color code, a color name, or a short name.
An RGB triplet is a three-element row vector whose elements specify the intensities of the red, green, and blue components of the color. The intensities must be in the range
[0,1]; for example,[0.4 0.6 0.7].A hexadecimal color code is a character vector or a string scalar that starts with a hash symbol (
#) followed by three or six hexadecimal digits, which can range from0toF. The values are not case sensitive. Thus, the color codes'#FF8800','#ff8800','#F80', and'#f80'are equivalent.
| Color Name | Short Name | RGB Triplet | Hexadecimal Color Code | Appearance |
|---|---|---|---|---|
'red' | 'r' | [1 0 0] | '#FF0000' |
|
'green' | 'g' | [0 1 0] | '#00FF00' |
|
'blue' | 'b' | [0 0 1] | '#0000FF' |
|
'cyan'
| 'c' | [0 1 1] | '#00FFFF' |
|
'magenta' | 'm' | [1 0 1] | '#FF00FF' |
|
'yellow' | 'y' | [1 1 0] | '#FFFF00' |
|
'black' | 'k' | [0 0 0] | '#000000' |
|
'white' | 'w' | [1 1 1] | '#FFFFFF' |
|
'none' | Not applicable | Not applicable | Not applicable | No color |
Here are the RGB triplets and hexadecimal color codes for the default colors MATLAB® uses in many types of plots.
| RGB Triplet | Hexadecimal Color Code | Appearance |
|---|---|---|
[0 0.4470 0.7410] | '#0072BD' |
|
[0.8500 0.3250 0.0980] | '#D95319' |
|
[0.9290 0.6940 0.1250] | '#EDB120' |
|
[0.4940 0.1840 0.5560] | '#7E2F8E' |
|
[0.4660 0.6740 0.1880] | '#77AC30' |
|
[0.3010 0.7450 0.9330] | '#4DBEEE' |
|
[0.6350 0.0780 0.1840] | '#A2142F' |
|
Edge colors, specified as one of the values in this table. The default edge color is black
with a value of [0 0 0]. If multiple polygons share an edge, then the
first polygon drawn controls the displayed edge color.
| Value | Description | Result |
|---|---|---|
RGB triplet, hexadecimal color code, or color name | Single color for all of the edges. See the following table for more details. |
|
'flat' | Different color for each edge. Use the vertex colors to set
the color of the edge that follows it. You must first specify
|
|
'interp' | Interpolated edge color. You must first specify
|
|
'none' | No edges displayed. | No edges displayed. |


RGB triplets and hexadecimal color codes are useful for specifying custom colors.
An RGB triplet is a three-element row vector whose elements specify the intensities of the red, green, and blue components of the color. The intensities must be in the range
[0,1]; for example,[0.4 0.6 0.7].A hexadecimal color code is a character vector or a string scalar that starts with a hash symbol (
#) followed by three or six hexadecimal digits, which can range from0toF. The values are not case sensitive. Thus, the color codes'#FF8800','#ff8800','#F80', and'#f80'are equivalent.
Alternatively, you can specify some common colors by name. This table lists the named color options, the equivalent RGB triplets, and hexadecimal color codes.
| Color Name | Short Name | RGB Triplet | Hexadecimal Color Code | Appearance |
|---|---|---|---|---|
'red' | 'r' | [1 0 0] | '#FF0000' |
|
'green' | 'g' | [0 1 0] | '#00FF00' |
|
'blue' | 'b' | [0 0 1] | '#0000FF' |
|
'cyan' | 'c' | [0 1 1] | '#00FFFF' |
|
'magenta' | 'm' | [1 0 1] | '#FF00FF' |
|
'yellow' | 'y' | [1 1 0] | '#FFFF00' |
|
'black' | 'k' | [0 0 0] | '#000000' |
|
'white' | 'w' | [1 1 1] | '#FFFFFF' |
|
Here are the RGB triplets and hexadecimal color codes for the default colors MATLAB uses in many types of plots.
| RGB Triplet | Hexadecimal Color Code | Appearance |
|---|---|---|
[0 0.4470 0.7410] | '#0072BD' |
|
[0.8500 0.3250 0.0980] | '#D95319' |
|
[0.9290 0.6940 0.1250] | '#EDB120' |
|
[0.4940 0.1840 0.5560] | '#7E2F8E' |
|
[0.4660 0.6740 0.1880] | '#77AC30' |
|
[0.3010 0.7450 0.9330] | '#4DBEEE' |
|
[0.6350 0.0780 0.1840] | '#A2142F' |
|
Line style, specified as one of the options listed in this table.
| Line Style | Description | Resulting Line |
|---|---|---|
'-' | Solid line |
|
'--' | Dashed line |
|
':' | Dotted line |
|
'-.' | Dash-dotted line |
|
'none' | No line | No line |