findgroups

Find groups and return group numbers

Description

example

G = findgroups(A) returns G, a vector of group numbers created from the grouping variable A. The output argument G contains integer values from 1 to N, indicating N distinct groups for the N unique values in A. For example, if A is {'b','a','a','b'}, then findgroups returns G as [2 1 1 2]. You can use G to split groups of data out of other variables. Use G as an input argument to splitapply in the Split-Apply-Combine Workflow.

findgroups treats empty character vectors and NaN, NaT, and undefined categorical values in A as missing values and returns NaN as the corresponding elements of G.

example

G = findgroups(A1,...,AN) creates group numbers from A1,...,AN. The findgroups function defines groups as the unique combinations of values across A1,...,AN. For example, if A1 is {'a','a','b','b'} and A2 is [0 1 0 0], then findgroups(A1,A2) returns G as [1 2 3 3], because the combination 'b' 0 occurs twice.

example

[G,ID] = findgroups(A) also returns the unique values for each group in ID. For example, if A is {'b','a','a','b'}, then findgroups returns G as [2 1 1 2] and ID as {'a','b'}. The arguments A and ID are the same data type, but need not be the same size.

example

[G,ID1,...,IDN] = findgroups(A1,...,AN) also returns the unique values for each group across ID1,...,IDN. The values across ID1,...,IDN define the groups. For example, if A1 is {'a','a','b','b'} and A2 is [0 1 0 0], then findgroups(A1,A2) returns G as [1 2 3 3], and ID1 and ID2 as {'a','a','b'} and [0 1 0].

example

G = findgroups(T) returns G, a vector of group numbers created from the variables in table T. The findgroups function treats all the variables in T as grouping variables.

example

[G,TID] = findgroups(T) also returns TID, a table that contains the unique values for each group. TID contains the unique combinations of values across the variables of T. The variables in T and TID have the same names, but the tables need not have the same number of rows.

Examples

collapse all

Use group numbers to split patient height measurements into groups by gender. Then calculate the mean height for each group.

Load patient heights and genders from the data file patients.mat.

load patients
whos Gender Height
  Name          Size            Bytes  Class     Attributes

  Gender      100x1             11412  cell                
  Height      100x1               800  double              

Specify groups by gender with findgroups.

G = findgroups(Gender);

Compare the first five elements of Gender and G. Where Gender contains 'Female', G contains 1. Where Gender contains 'Male', G contains 2.

Gender(1:5)
ans = 5x1 cell
    {'Male'  }
    {'Male'  }
    {'Female'}
    {'Female'}
    {'Female'}

G(1:5)
ans = 5×1

     2
     2
     1
     1
     1

Split the Height variable into two groups of heights using G. Apply the mean function. The groups contain the mean heights of female and male patients, respectively.

splitapply(@mean,Height,G)
ans = 2×1

   65.1509
   69.2340

Calculate mean blood pressures for groups of patients from measurements grouped by gender and status as a smoker.

Load blood pressure readings, gender, and smoking data for patients from the data file patients.mat.

load patients
whos Systolic Diastolic Gender Smoker
  Name             Size            Bytes  Class      Attributes

  Diastolic      100x1               800  double               
  Gender         100x1             11412  cell                 
  Smoker         100x1               100  logical              
  Systolic       100x1               800  double               

Specify groups using gender and smoking information about the patients. G contains integers from one to four because there are four possible combinations of values from Smoker and Gender.

G = findgroups(Smoker,Gender);
G(1:10)
ans = 10×1

     4
     2
     1
     1
     1
     1
     3
     2
     2
     1

Calculate the mean blood pressure for each group.

meanSystolic = splitapply(@mean,Systolic,G);
meanDiastolic = splitapply(@mean,Diastolic,G);
mBP = [meanSystolic,meanDiastolic]
mBP = 4×2

  119.4250   79.0500
  119.3462   79.8846
  129.0000   89.2308
  129.5714   90.3333

Calculate the median heights for groups of patients, and display the results in a table. To define the groups of patients, use the additional output argument from findgroups.

Load patient heights and genders from the data file patients.mat.

load patients
whos Gender Height
  Name          Size            Bytes  Class     Attributes

  Gender      100x1             11412  cell                
  Height      100x1               800  double              

Specify groups by gender with findgroups. The values in the output argument gender define the groups that findgroups finds in the grouping variable.

[G,gender] = findgroups(Gender);

Calculate the median heights. Create a table that contains the median heights.

medianHeight = splitapply(@median,Height,G);
T = table(gender,medianHeight)
T=2×2 table
      gender      medianHeight
    __________    ____________

    {'Female'}         65     
    {'Male'  }         69     

Calculate mean blood pressures for groups of patients, and display the results in a table. To define the groups of patients, use the additional output arguments from findgroups.

Load blood pressure readings, gender, and smoking data for 100 patients from the data file patients.mat.

load patients
whos Systolic Diastolic Gender Smoker
  Name             Size            Bytes  Class      Attributes

  Diastolic      100x1               800  double               
  Gender         100x1             11412  cell                 
  Smoker         100x1               100  logical              
  Systolic       100x1               800  double               

Specify groups using gender and smoking information about the patients. Calculate mean blood pressure for each group. The values across the output arguments gender and smoker define the groups that findgroups finds in the grouping variables.

[G,gender,smoker] = findgroups(Gender,Smoker);
meanSystolic = splitapply(@mean,Systolic,G);
meanDiastolic = splitapply(@mean,Diastolic,G);

Create a table with the mean blood pressure for each group of patients.

T = table(gender,smoker,meanSystolic,meanDiastolic)
T=4×4 table
      gender      smoker    meanSystolic    meanDiastolic
    __________    ______    ____________    _____________

    {'Female'}    false        119.42           79.05    
    {'Female'}    true            129          89.231    
    {'Male'  }    false        119.35          79.885    
    {'Male'  }    true         129.57          90.333    

Calculate mean blood pressures for patients using grouping variables that are in a table.

Load gender and smoking data for 100 patients into a table.

load patients
T = table(Gender,Smoker);
T(1:5,:)
ans=5×2 table
      Gender      Smoker
    __________    ______

    {'Male'  }    true  
    {'Male'  }    false 
    {'Female'}    false 
    {'Female'}    false 
    {'Female'}    false 

Specify groups of patients using the Gender and Smoker variables in T.

G = findgroups(T);

Calculate mean blood pressures from the data variables Systolic and Diastolic.

meanSystolic = splitapply(@mean,Systolic,G);
meanDiastolic = splitapply(@mean,Diastolic,G);
mBP = [meanSystolic,meanDiastolic]
mBP = 4×2

  119.4250   79.0500
  129.0000   89.2308
  119.3462   79.8846
  129.5714   90.3333

Create a table of mean blood pressures for patients grouped by gender and status as a smoker or nonsmoker.

Load gender and smoking data for patients into a table.

load patients
T = table(Gender,Smoker);

Specify groups of patients using the Gender and Smoker variables in T. The output table TID identifies the groups.

[G,TID] = findgroups(T);
TID
TID=4×2 table
      Gender      Smoker
    __________    ______

    {'Female'}    false 
    {'Female'}    true  
    {'Male'  }    false 
    {'Male'  }    true  

Calculate mean blood pressures from the data variables Systolic and Diastolic. Append mean blood pressures to TID.

TID.meanSystolic = splitapply(@mean,Systolic,G);
TID.meanDiastolic = splitapply(@mean,Diastolic,G)
TID=4×4 table
      Gender      Smoker    meanSystolic    meanDiastolic
    __________    ______    ____________    _____________

    {'Female'}    false        119.42           79.05    
    {'Female'}    true            129          89.231    
    {'Male'  }    false        119.35          79.885    
    {'Male'  }    true         129.57          90.333    

Input Arguments

collapse all

Grouping variable, specified as a vector, a cell array of character vectors, or a string array. The unique values in A identify groups.

If A is a vector, then it can be numeric or of data type categorical, calendarDuration, datetime, duration, logical, or string.

Grouping variables, specified as a table. findgroups treats each table variable as a separate grouping variable. The variables can be numeric or of data type categorical, calendarDuration, datetime, duration, logical, or string.

Output Arguments

collapse all

Group numbers, returned as a vector of positive integers. For N groups identified in the grouping variables, every integer between 1 and N specifies a group. G contains NaN where any grouping variable contains an empty character vector or a NaN, NaT, or undefined categorical value.

  • If the grouping variables are vectors, then G and the grouping variables all are the same size.

  • If the grouping variables are in a table, the length of G is equal to the number of rows of the table.

Values that identify each group, returned as a vector or cell array of character vectors. The values of ID are the sorted unique values of A.

The unique values that identify each group, returned as a table. The variables of TID have the sorted unique values from the corresponding variables of T. However, TID and T need not have the same number of rows.

More About

collapse all

Split-Apply-Combine Workflow

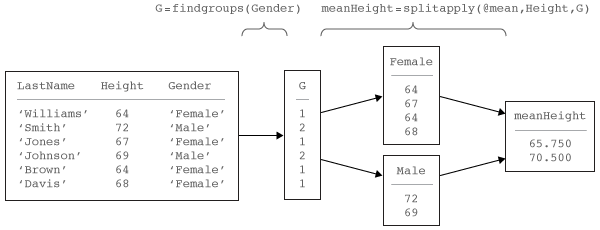
The Split-Apply-Combine workflow is common in data analysis. In this workflow, the analyst splits the data into groups, applies a function to each group, and combines the results. The diagram shows a typical example of the workflow and the parts of the workflow implemented by findgroups and splitapply.

Extended Capabilities

Introduced in R2015b