Grouping Variables To Split Data
You can use grouping variables to split data variables into groups. Typically, selecting grouping variables is the first step in the Split-Apply-Combine workflow. You can split data into groups, apply a function to each group, and combine the results. You also can denote missing values in grouping variables, so that corresponding values in data variables are ignored.
Grouping Variables
Grouping variables are variables used to group, or categorize, observations—that is, data values in other variables. A grouping variable can be any of these data types:
Numeric, logical, categorical,
datetime, ordurationvectorCell array of character vectors
Table, with table variables of any data type in this list
Data variables are the variables that contain observations. A grouping variable must have a value corresponding to each value in the data variables. Data values belong to the same group when the corresponding values in the grouping variable are the same.
This table shows examples of data variables, grouping variables, and the groups that you can create when you split the data variables using the grouping variables.
Data Variable | Grouping Variable | Groups of Data |
|---|---|---|
|
|
|
|
|
|
|
|
|
You can give groups of data meaningful names when you use cell arrays of character vectors or categorical arrays as grouping variables. A categorical array is an efficient and flexible choice of grouping variable.
Group Definition
Typically, there are as many groups as there are unique values in the grouping variable. (A categorical array also can include categories that are not represented in the data.) The groups and the order of the groups depend on the data type of the grouping variable.
For numeric, logical,
datetime, ordurationvectors, or cell arrays of character vectors, the groups correspond to the unique values sorted in ascending order.For categorical arrays, the groups correspond to the unique values observed in the array, sorted in the order returned by the
categoriesfunction.
The findgroups function can accept multiple
grouping variables, for example G = findgroups(A1,A2).
You also can include multiple grouping variables in a table, for example T
= table(A1,A2); G = findgroups(T). The findgroups function
defines groups by the unique combinations of values across corresponding
elements of the grouping variables. findgroups decides
the order by the order of the first grouping variable, and then by
the order of the second grouping variable, and so on. For example,
if A1 = {'a','a','b','b'} and A2 = [0
1 0 0], then the unique values across the grouping variables
are 'a' 0, 'a' 1, and 'b'
0, defining three groups.
The Split-Apply-Combine Workflow
After you select grouping variables and split data variables
into groups, you can apply functions to the groups and combine the
results. This workflow is called the Split-Apply-Combine workflow.
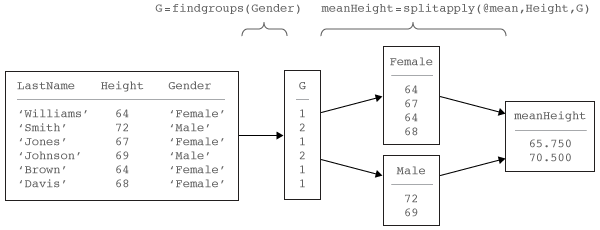
You can use the findgroups and splitapply functions
together to analyze groups of data in this workflow. This diagram
shows a simple example using the grouping variable Gender and
the data variable Height to calculate the mean
height by gender.
The findgroups function returns a vector
of group numbers that define groups based on
the unique values in the grouping variables. splitapply uses
the group numbers to split the data into groups efficiently before
applying a function.
Missing Group Values
Grouping variables can have missing values. This table shows
the missing value indicator for each data type. If a grouping variable
has missing values, then findgroups assigns NaN as
the group number, and splitapply ignores the corresponding
values in the data variables.
Grouping Variable Data Type | Missing Value Indicator |
|---|---|
Numeric |
|
Logical | (Cannot be missing) |
Categorical |
|
|
|
|
|
Cell array of character vectors |
|
|
String |
|
See Also
findgroups | rowfun | splitapply | varfun