Time Scope
Display and analyze signals generated during simulation and log signal data to MATLAB
- Library:
DSP System Toolbox / Sinks
DSP System Toolbox HDL Support / Sinks
Description
The Simulink® Scope block and DSP System Toolbox™ Time Scope block display time domain signals.


The two blocks have identical functionality, but different default settings. The Time Scope is optimized for discrete time processing. The Scope is optimized for general time-domain simulation. For a side-by-side comparison, see Simulink Scope Versus DSP System Toolbox Time Scope (Simulink).
Oscilloscope features:
Triggers — Set triggers to sync repeating signals and pause the display when events occur.
Cursor Measurements — Measure signal values using vertical and horizontal cursors.
Signal Statistics — Display the maximum, minimum, peak-to-peak difference, mean, median, and RMS values of a selected signal.
Peak Finder — Find maxima, showing the x-axis values at which they occur.
Bilevel Measurements — Measure transitions, overshoots, undershoots, and cycles.
You must have a Simscape™ or DSP System Toolbox license to use the Peak Finder, Bilevel Measurements, and Signal Statistics.
Scope display features:
Simulation control — Debug models from a Scope window using Run, Step Forward, and Step Backward toolbar buttons.
Multiple signals — Plot multiple signals on the same y-axis (display) using multiple input ports.
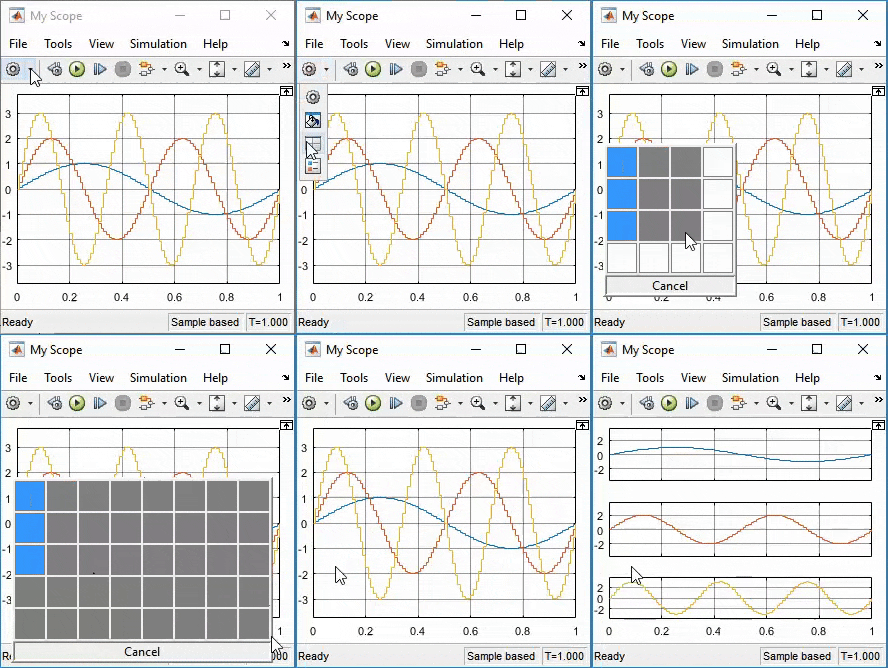
Multiple y-axes (displays) — Display multiple y-axes. All the y-axes have a common time range on the x-axis.
Modify parameters — Modify scope parameter values before and during a simulation.
Axis autoscaling — Autoscale axes during or at the end of a simulation. Margins are drawn at the top and bottom of the axes.
Display data after simulation — Scope data is saved during a simulation. If a scope is closed at the start of a simulation, when you open the scope after a simulation, the scope displays simulation results for attached input signals.
Note
If you have a high sample rate or long simulation time, you may run into issues with memory or system performance because the scope saves data internally. To limit the amount of data saved for scope visualization, use the Limit data points to last (Simulink) property.
For information on controlling a scope programmatically, see Control Scope Blocks Programmatically (Simulink).
Limitations
Do not use scope blocks in a Library. If you place a scope block inside a library block with a locked link or in a locked library, Simulink displays an error when trying to open the scope window. To display internal data from a library block, add an output port to the library block, and then connect the port to a Scope block in your model.
If you step through a model, the scope only updates when the scope block runs. This means that the time shown in the status bar may not match the model time.
When connected to a constant signal, a scope block may plot a single point.
The scope shows gaps in the display when the signal value is
NaN.When you visualize multiple frame-based signals in the scope, some samples of signals with a frame size of 1 might not be displayed. To visualize these signals, move the signals with frame size of 1 to a separate scope.
Scope displays have limitations in Rapid Accelerator mode. See Behavior of Scopes and Viewers with Rapid Accelerator Mode (Simulink)
When the Scope is in a ForEach subsystem, the scope only displays the last index.
Ports
Input
Properties
Model Examples
Block Characteristics
Data Types |
|
Direct Feedthrough |
|
Multidimensional Signals |
|
Variable-Size Signals |
|
Zero-Crossing Detection |
|
[a] Virtual bus not supported. Nonvirtual bus supported only in normal and accelerator mode simulation. Data logging for nonvirtual bus supported only in the dataset format | |
Tips
If you run your simulation for a long time, you may run into out-of-memory issues because the scope saves data. To limit the amount of data saved for scope visualization, use the Limit data points to last property.
Extended Capabilities
See Also
Blocks
- Floating Scope (Simulink) | Scope Viewer (Simulink)
Objects
Topics
- Simulate a Model Interactively (Simulink)
- Step Through a Simulation (Simulink)
- Common Scope Block Tasks (Simulink)
- Floating Scope and Scope Viewer Tasks (Simulink)
- Scope Triggers Panel (Simulink)
- Cursor Measurements Panel (Simulink)
- Scope Signal Statistics Panel (Simulink)
- Scope Bilevel Measurements Panel (Simulink)
- Peak Finder Measurements Panel (Simulink)
- Control Scope Blocks Programmatically (Simulink)


