Model Coverage for Stateflow Charts
How Model Coverage Reports Work for Stateflow Charts
A model coverage report is generated automatically if you simulate your model
using the Run button. If you did not use the
Run button, or you loaded coverage data without
simulating the model, generate a Model Coverage report using cvhtml. For
Stateflow® charts, Simulink®
Coverage™ records the execution of the chart itself and the execution of
states, transition decisions, and individual conditions that compose each
decision. After simulation ends, the model coverage reports on how
thoroughly a model was tested. The report shows:
How many times each exclusive sub-state is executed or exited from its parent superstate and entered due to parent superstate history
How many times each transition decision has been evaluated as true or false
How many times each condition has been evaluated as true or false
Note
To measure model coverage data for a Stateflow chart, you must:
Have a Stateflow license.
Have debugging/animation enabled for the chart.
Specify Coverage Report Settings for Stateflow Charts
Specify coverage recording settings from the Coverage pane of the Configuration Parameters dialog box.
Enabling coverage analysis also enables the selection of different coverage metrics. The following sections address only coverage metrics that affect reports for Stateflow charts. These metrics include decision coverage, condition coverage, and MCDC coverage.
Cyclomatic Complexity for Stateflow Charts
Cyclomatic complexity is a measure of the complexity of a software module based on its edges, nodes, and components within a control-flow chart. It provides an indication of how many times you need to test the module.
The calculation of cyclomatic complexity is as follows:
CC = E - N + p
where CC is the cyclomatic complexity, E
is the number of edges, N is the number of nodes, and
p is the number of components.
Within the Model Coverage tool, each decision is exactly equivalent to a single control flow node, and each decision outcome is equivalent to a control flow edge. Any additional structure in the control-flow chart is ignored since it contributes the same number of nodes as edges and therefore has no effect on the complexity calculation. Therefore, you can express cyclomatic complexity as follows:
CC = OUTCOMES - DECISIONS + p
For analysis purposes, each chart counts as a single component.
Decision Coverage for Stateflow Charts
Decision coverage interprets a model execution in terms of underlying decisions where behavior or execution must take one outcome from a set of mutually exclusive outcomes.
Note
Full coverage for an object of decision means that every decision has had at least one occurrence of each of its possible outcomes.
Decisions belong to an object making the decision based on its contents or properties. The following table lists the decisions recorded for model coverage for the Stateflow objects owning them. The sections that follow the table describe these decisions and their possible outcomes.
Object | Possible Decisions |
|---|---|
Chart | If a chart is a triggered Simulink block, it must decide whether or not to execute its block. If a chart contains exclusive (OR) substates, it must decide which of its states to execute. |
State | If a state is a superstate containing exclusive (OR) substates, it must decide which substate to execute. If a state has
|
Transition | If a transition is a conditional transition, it must decide whether or not to exit its active source state or junction and enter another state or junction. |
Chart as a Triggered Simulink Block Decision
If the chart is a triggered block in a Simulink model, the decision to execute the block is tested. If
the block is not triggered, there is
no decision to execute the
block, and the measurement of decision coverage is not applicable
(NA).
Chart Containing Exclusive OR Substates Decision
If the chart contains exclusive (OR) substates, the decision on which
substate to execute is tested. If the chart contains only parallel
AND substates, this coverage measurement is not applicable
(NA).
Superstate Containing Exclusive OR Substates Decision
Since a chart is hierarchically processed from the top down, procedures such as exclusive (OR) substate entry, exit, and execution are sometimes decided by the parenting superstate.
Note
Decision coverage for superstates applies only to exclusive (OR) substates. A superstate makes no decisions for parallel (AND) substates.
Since a superstate must decide which exclusive (OR) substate to process, the number of decision outcomes for the superstate is the number of exclusive (OR) substates that it contains. In the examples that follow, the choice of which substate to process can occur in one of three possible contexts.
Note
Implicit transitions appear as dashed lines in the following examples.
| Context | Example | Decisions That Occur |
|---|---|---|
Active call | States
|
During processing of state
|
Implicit substate exit | A transition takes place whose source is superstate A and whose destination is state B.
| If the superstate has two exclusive (OR) substates, it is the decision of superstate A which substate performs the implicit transition from substate to superstate. |
Substate entry with a history junction | A history junction records which substate was last active before the superstate was exited.
| If that superstate becomes the destination of one or more transitions, the history junction decides which previously active substate to enter. |


For more information, see State Details Report Section.
State with On Event_Name Action Statement Decision
A state that has an on
event_name action
statement must decide whether to execute that statement based on the
reception of a specified event or on an accumulation of the
specified event when using temporal logic operators.
Conditional Transition Decision
A conditional transition is a transition with a triggering event and/or a guarding condition. In a conditional transition from one state to another, the decision to exit one state and enter another is credited to the transition itself.
Note
Only conditional transitions receive decision coverage. Transitions without decisions are not applicable to decision coverage.
Condition Coverage for Stateflow Charts
Condition coverage reports on the extent to which all possible outcomes are achieved for individual subconditions composing a transition decision or for logical expressions in assignment statements in states and transitions.
For example, for the decision [A & B & C] on a transition, condition coverage reports on the true and false occurrences of each of the subconditions A, B, and C. This results in eight possible outcomes: true and false for each of three subconditions.
| Outcome | A | B | C |
|---|---|---|---|
| 1 | T | T | T |
| 2 | T | T | F |
| 3 | T | F | T |
| 4 | T | F | F |
| 5 | F | T | T |
| 6 | F | T | F |
| 7 | F | F | T |
| 8 | F | F | F |
For more information, see Transition Details Report Section.
MCDC Coverage for Stateflow Charts
The Modified Condition Decision/Coverage (MCDC) option reports a test's coverage of occurrences in which changing an individual subcondition within a logical expression results in changing the entire expression from true to false or false to true.
For example, if a transition executes on the condition [C1 & C2
& C3 | C4 & C5], the MCDC report for that
transition shows actual occurrences for each of the five subconditions
(C1, C2, C3, C4, C5) in which changing its result
from true to false is able to change the result of the entire condition from
true to false.
Relational Boundary Coverage for Stateflow Charts
If a transition in a Stateflow chart involves a relational operation, it receives relational boundary coverage. For more information, see Relational Boundary Coverage.
Simulink Design Verifier Coverage for Stateflow Charts
You can use the following Simulink Design Verifier™ functions inside Stateflow charts:
sldv.condition(Simulink Design Verifier)sldv.test(Simulink Design Verifier)sldv.assume(Simulink Design Verifier)sldv.prove(Simulink Design Verifier)
If you do not have a Simulink Design Verifier license, you can collect model coverage for a Stateflow chart containing these functions, but you cannot analyze the model using the Simulink Design Verifier software.
When you specify the Objectives and Constraints coverage metric in the Coverage pane of the Configuration Parameters dialog box, the Simulink Coverage software records coverage for these functions.
Each of these functions evaluates an expression
expr, for example,
sldv.test(,
where expr)expr is
any valid Boolean MATLAB® expression. Simulink
Design Verifier coverage measures the number of time steps that the expression
expr evaluates to
true.
If expr is true for at least one
time step, Simulink
Design Verifier coverage for that function is 100%. Otherwise, the Simulink
Coverage software reports coverage for that function as 0%.
Consider a model that contains this Stateflow chart:

To collect coverage for Simulink Design Verifier functions, on the Coverage pane in the Configuration Parameters dialog box, select Objectives and Constraints.
After simulation, the model coverage report lists coverage for the
sldv.condition, sldv.assume,
sldv.prove, and sldv.test
functions.
Model Coverage Reports for Stateflow Charts
The following sections of a Model Coverage report were generated by simulating
the sf_boiler model, which includes the Bang-Bang
Controller chart. The coverage metrics for MCDC are enabled for this report.
Summary Report Section
The Summary section shows coverage results for the entire test and appears at the beginning of the Model Coverage report.

Each line in the hierarchy summarizes the coverage results at that level and the levels below it. You can click a hyperlink to a later section in the report with the same assigned hierarchical order number that details that coverage and the coverage of its children.
The top level, sf_boiler, is the Simulink model itself. The second level, Bang-Bang Controller,
is the Stateflow chart. The next levels are superstates within the
chart, in order of hierarchical containment. Each superstate uses an
SF: prefix. The bottom level, Boiler Plant model, is an additional
subsystem in the model.
Subsystem and Chart Details Report Sections
When recording coverage for a Stateflow chart, the Simulink Coverage software reports two types of coverage for the chart—Subsystem and Chart.
Subsystem — This section reports coverage for the chart:
Coverage (this object): Coverage data for the chart as a container object
Coverage (inc.) descendants: Coverage data for the chart and the states and transitions in the chart.
If you click the hyperlink of the subsystem name in the section title, the Bang-Bang Controller block is highlighted in the block diagram.
Decision coverage is not applicable (
NA) because this chart does not have an explicit trigger. Condition coverage and MCDC are not applicable (NA) for a chart, but apply to its descendants.
Chart — This section reports coverage for the chart:
Coverage (this object): Coverage data for the chart and its inputs
Coverage (inc.) descendants: Coverage data for the chart and the states and transitions in the chart.
If you click the hyperlink of the chart name in the section title, the chart opens in the Stateflow Editor.
Decision coverage is listed appears for the chart and its descendants. Condition coverage and MCDC are not applicable (
NA) for a chart, but apply to its descendants.
State Details Report Section
For each state in a chart, the coverage report includes a State section with details about the coverage recorded for that state.
In the sf_boiler model, the state
On resides in the box
Heater. On is a
superstate that contains:
Two substates
HIGHandNORMA history junction
The function
warm

The coverage report includes a State section on
the state On.
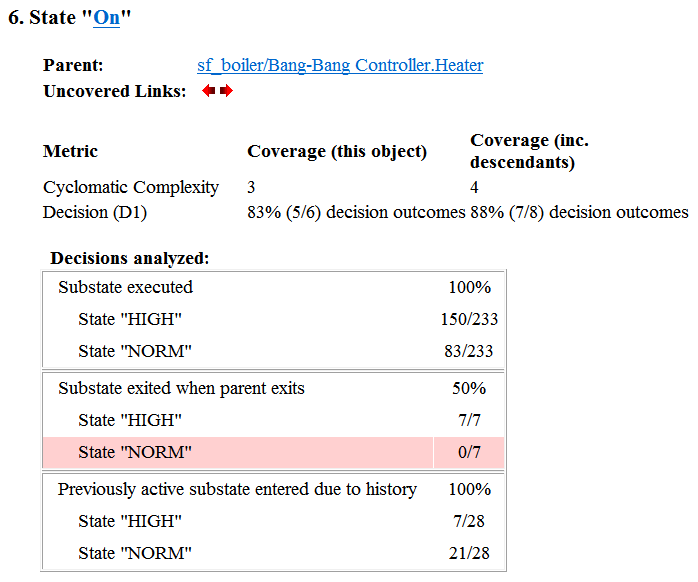
The decision coverage for the On state tests the
decision of which substate to execute.
The three decisions are listed in the report:
Under Substate executed, which substate to execute when
Onexecutes.Under Substate exited when parent exited, which substate is active when
Onexits.NORMis listed as never being active whenOnexits because the coverage tool sees the supertransition fromNORMtoOffas a transition fromOntoOff.Under Previously active substate entered due to history, which substate to reenter when
Onre-executes. The history junction records the previously active substate.
Because each decision can result in either HIGH or
NORM, the total possible outcomes are 3 × 2 = 6. The results indicate that five of six possible
outcomes were tested during simulation.
Cyclomatic complexity and decision coverage also apply to descendants
of the On state. The decision required by the
condition [warm()] for the transition from HIGH
to NORM brings the total possible decision outcomes to 8. Condition
coverage and MCDC are not applicable (NA) for a
state.
Note
Nodes and edges that make up the cyclomatic complexity calculation have no direct relationship with model objects (states, transitions, and so on). Instead, this calculation requires a graph representation of the equivalent control flow.
Transition Details Report Section
Reports for transitions appear under the report sections of their owning objects. Transitions do not appear in the model hierarchy of the Summary section, since the hierarchy is based on superstates that own other Stateflow objects.
![]()
The decision for this transition depends on the time delay of 40
seconds and the condition [cold()]. If, after a
40 second delay, the environment is cold (cold() =
1), the decision to execute this transition and
turn the Heater on is made. For other time intervals or environment
conditions, the decision is made not to execute.
For decision coverage, both true and false outcomes occurred. Because two of two decision outcomes occurred, coverage was full or 100%.
Condition coverage shows that only 4 of 6 condition outcomes were
tested. The temporal logic statement
after(40,sec) represents two conditions:
the occurrence of sec and the time delay
after(40,sec). Therefore, three
conditions on the transition exist: sec,
after(40,sec), and
cold(). Since each of these decisions can
be true or false, six possible condition outcomes exist.
The Conditions analyzed table shows each condition as a row with the recorded number of occurrences for each outcome (true or false). Decision rows in which a possible outcome did not occur are shaded. For example, the first and the third rows did not record an occurrence of a false outcome.
In the MCDC report, all sets of occurrences of the transition conditions are scanned for a particular pair of decisions for each condition in which the following are true:
The condition varies from true to false.
All other conditions contributing to the decision outcome remain constant.
The outcome of the decision varies from true to false, or the reverse.
For three conditions related by an implied AND operator, these criteria can be satisfied by the occurrence of these conditions.
Condition Tested | True Outcome | False Outcome |
|---|---|---|
1 | TTT | Fxx |
2 | TTT | TFx |
3 | TTT | TTF |
Notice that in each line, the condition tested changes from true to false while the other condition remains constant. Irrelevant contributors are coded with an "x" (discussed below). If both outcomes occur during testing, coverage is complete (100%) for the condition tested.
The preceding report example shows coverage only for condition 2. The false outcomes required for conditions 1 and 3 did not occur, and are indicated by parentheses for both conditions. Therefore, condition rows 1 and 3 are shaded. While condition 2 has been tested, conditions 1 and 3 have not and MCDC is 33%.
For some decisions, the values of some conditions are
irrelevant under certain circumstances. For example, in the decision
[C1 & C2 & C3 | C4 & C5] the
left side of the | is false if
any one of the conditions
C1, C2, or
C3 is false. The same applies to the
right side result if either C4 or
C5 is false. When searching for matching
pairs that change the outcome of the decision by changing one
condition, holding some of the remaining conditions constant is
irrelevant. In these cases, the MCDC report marks these conditions
with an "x" to indicate their irrelevance as a contributor to the
result. These conditions appear as shown.
Consider the first matched pair. Since condition 1 is true in the
True outcome column, it
must be false in the matching False
outcome column. This makes the conditions C2 and
C3 irrelevant for the false outcome since
C1 & C2 & C3 is
always false if
C1 is false. Also, since the false
outcome is required to evaluate to false, the evaluation of
C4 & C5 must also be false. In this
case, a match was found with C4 = F, making
condition C5 irrelevant.
Model Coverage for Stateflow State Transition Tables
State transition tables are an alternative way of expressing modal logic in Stateflow. Stateflow charts represent modal logic graphically, and state transition tables can represent equivalent modal logic in tabular form. For more information, see State Transition Tables (Stateflow).
Coverage results for state transition tables are the same as coverage results
for equivalent Stateflow charts, except for a slight difference that arises in coverage
of temporal logic. For example, consider the temporal logic expression
after(4, tick) in the Mode Logic chart of the
slvnvdemo_covfilt example model.

In chart coverage, the after(4, tick) transition represents
two conditions: the occurrence of tick and the time delay
after(4, tick). Since the temporal event
tick is
never false, the first condition is not
satisfiable, and you cannot record 100% condition and MCDC coverage for the
transition after(4, tick).
In state transition table coverage, the after(4, tick)
transition represents a single decision, with
no subcondition for the occurrence of
tick. Therefore, only decision coverage is
recorded.
For state transition tables containing temporal logic decisions, as in the above example, condition coverage and MCDC is not recorded.
Model Coverage for Stateflow Atomic Subcharts
In a Stateflow chart, an atomic subchart is a graphical object that allows you to reuse the same state or subchart across multiple charts and models.
When you specify to record coverage data for a model during simulation, the Simulink Coverage software records coverage for any atomic subcharts in your model. The coverage data records the execution of the chart itself, and the execution of states, transition decisions, and individual conditions that compose each decision in the atomic subchart.
Simulate the doc_atomic_subcharts_map_iodata example model
and record decision coverage:
Open the
doc_atomic_subcharts_map_iodatamodel.This model contains two Sine Wave blocks that supply input signals to the Stateflow chart. Chart contains two atomic subcharts—A and B—that are linked from the same library chart, also named A. The library chart contains the following objects:

In the Simulink Editor, select Model Settings on the Modeling tab. Select the Coverage pane of the Configuration Parameters dialog box.
Select Enable coverage analysis and then select Entire System.
Click OK to close the Configuration Parameters dialog box.
Simulate the
doc_atomic_subcharts_map_iodatamodel.When the simulation completes, the coverage report opens.
The report provides coverage data for atomic subcharts A and B in the following forms:
For the atomic subchart instance and its contents. Decision coverage is not applicable (
NA) because this chart does not have an explicit trigger.
For the library chart A and its contents. The chart itself achieves 100% coverage on the input
u1, and 88% coverage on the states and transitions inside the library chart.
Atomic subchart B is a copy of the same library chart A. The coverage of the contents of subchart B is identical to the coverage of the contents of subchart A.
Model Coverage for Stateflow Truth Tables
Types of Coverage in Stateflow Truth Tables
Simulink Coverage software reports model coverage for the decisions the objects make in a Stateflow chart during model simulation. The report includes coverage for the decisions the truth table functions make.
| For this type of truth table... | The report includes coverage data for... |
|---|---|
| Stateflow Classic | Conditions only. |
| MATLAB | Conditions and only those actions that have decision points. Note With the MATLAB for code generation action language, you can specify decision points in actions using control flow constructs, such as loops and switch statements. |
Note
To measure model coverage data for a Stateflow truth table, you must have a Stateflow license. For more information about Stateflow truth tables, see Obtain Cumulative Coverage for Reusable Subsystems and Stateflow® Constructs.
Analyze Coverage in Stateflow Truth Tables
If you have a Stateflow license, you can generate a model coverage report for a truth table.
Consider the following model.

The Stateflow chart contains the following truth table:

When you simulate the model and collect coverage, the model coverage report includes the following data:

The Coverage (this object) column shows
no coverage. The reason is that
the container object for the truth table function—the
Stateflow chart—does not decide whether to execute the
ttable truth table.
The Coverage (inc. descendants) column shows coverage for the graphical function. The graphical function has the decision logic that makes the transitions for the truth table. The transitions in the graphical function contain the decisions and conditions of the truth table. Coverage for the descendants in the Coverage (inc. descendants) column includes coverage for these conditions and decisions. Function calls to the truth table test the model coverage of these conditions and decisions.
Note
See View Generated Content for Stateflow Truth Tables (Stateflow) for a description of the graphical function for a truth table.
Coverage for the decisions and their individual conditions in the
ttable truth table function are as
follows.
Colored Stateflow Chart Coverage Display
The Model Coverage tool displays model coverage results for individual blocks directly in Simulink diagrams. If you enable this feature, the Model Coverage tool:
Highlights Stateflow objects that receive model coverage during simulation
Provides a context-sensitive display of summary model coverage information for each object
Note
The coverage tool changes colors only for open charts at the time coverage information is reported. When you interact with the chart, such as selecting a transition or a state, colors revert to default values.
For details on enabling and selecting this feature in the Simulink window, see Enable Coverage Highlighting.
Display Model Coverage with Model Coloring
Once you enable display coverage with model coloring, anytime that the model generates a model coverage report, individual chart objects receiving coverage appear highlighted with light green or light red.
Open the
sf_carmodel.In the Modeling tab, select Model Settings.
In the Coverage pane of the Configuration Parameters dialog box, select Enable coverage analysis.
Click OK.
On the Simulation tab, simulate the model by clicking the Run button.
After simulation ends, chart objects with coverage appear highlighted.

Object highlighting indicates coverage as follows:
Light green for full coverage
Light red for partial coverage
No color for zero coverage
Note
To revert the chart to show original colors, select and deselect any objects.
Click
selection_statein the chart.The following summary report appears.

When you click a highlighted Stateflow object, the summarized coverage for that object appears in the Coverage Display Window. Clicking the hyperlink opens the section of the coverage report for this object.
Tip
You can set the Coverage Display Window to appear for a block in response to a hovering mouse cursor instead of a mouse click in one of two ways:
Select the downward arrow on the right side of the Coverage Display Window and select Focus.
Right-click a colored block and select Coverage > Display details on mouse-over.
Code Coverage for C/C++ code in Stateflow Charts
Simulink Coverage can record code coverage if your Stateflow chart contains custom C/C++ code. For more information, see Coverage for Custom C/C++ Code in Simulink Models.
Obtain Cumulative Coverage for Reusable Subsystems and Stateflow® Constructs
This example shows how to create and view cumulative coverage results for a model with a reusable subsystem.
Simulink® Coverage™ provides cumulative coverage for multiple instances of identically configured:
Reusable subsystems
Stateflow™ constructs
To obtain cumulative coverage, you add the individual coverage results at the command line. You can get cumulative coverage results for multiple instances across models and test harnesses by adding the individual coverage results.
Open example model
At the MATLAB® command line, type:
model = 'slvnvdemo_cv_mutual_exclusion';
open_system(model);

This model has two instances of a reusable subsystem. The instances are named Subsystem 1 and Subsystem 2.
Get decision coverage for Subsystem 1
Execute the commands for Subsystem 1 decision coverage:
testobj1 = cvtest([model '/Subsystem 1']);
testobj1.settings.decision = 1;
covobj1 = cvsim(testobj1);
Get decision coverage for Subsystem 2
Execute the commands for Subsystem 2 decision coverage:
testobj2 = cvtest([model '/Subsystem 2']);
testobj2.settings.decision = 1;
covobj2 = cvsim(testobj2);
Add coverage results for Subsystem 1 and Subsystem 2
Execute the command to create cumulative decision coverage for Subsystem 1 and Subsystem 2:
covobj3 = covobj1 + covobj2;
Generate coverage report for Subsystem 1
Create an HTML report for Subsystem 1 decision coverage:
cvhtml('subsystem1',covobj1)
The report indicates that decision coverage is 50% for Subsystem 1. The true condition for enable logical value is not analyzed.
Generate coverage report for Subsystem 2
Create an HTML report for Subsystem 2 decision coverage:
cvhtml('subsystem2',covobj2)
The report indicates that decision coverage is 50% for Subsystem 2. The false condition for enable logical value is not analyzed.
Generate coverage report for cumulative coverage of Subsystem 1 and Subsystem 2
Create an HTML report for cumulative decision coverage for Subsystem 1 and Subsystem 2:
cvhtml('cum_subsystem',covobj3)
Cumulative decision coverage for reusable subsystems Subsystem 1 and Subsystem 2 is 100%. Both the true and false conditions for enable logical value are analyzed.