uitable
Create table user interface component
Description
uit = uitableTable UI
component object. If there is no figure available, MATLAB® calls the figure function to create
one.
uit = uitable(Name,Value)
uit = uitable(parent)figure or uifigure function, or a child
container such as a panel. Property values for uitable vary
slightly depending on whether the app is created with the
figure or uifigure function. For more
information, see Name-Value Pair Arguments.
uit = uitable(parent,Name,Value)
Examples
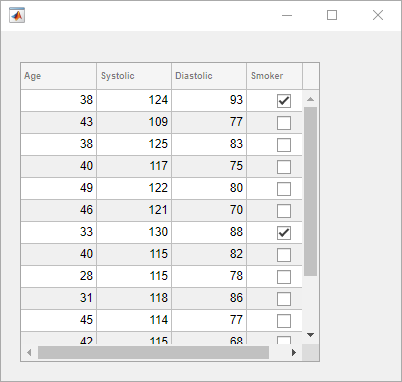
Display Table Array Data
Starting in R2018a, you can display table array data in a table UI
component. This type of data is supported only when the table UI component is in
a figure created with the uifigure function. App Designer
uses this type of figure for creating apps.
Create table array t by calling the
readtable function to read data from a file. Select
four variables and 15 rows from t.
t = readtable('patients.xls');
vars = {'Age','Systolic','Diastolic','Smoker'};
t = t(1:15,vars);
Create a table UI component, and specify t as the
data.
fig = uifigure;
uit = uitable(fig,'Data',t);
Update Visualizations for Sorted Display Data
Starting in R2019a, you can sort the columns of a table UI
component that has table array data stored in its
Data property. This type of data is supported only when
the table UI component is in a figure created with the uifigure function. App Designer
uses this type of figure for creating apps.
Display table array data and update the plot when a user
sorts the columns or edits the cells.
First, create a program file called tsunamisData.m.
Within the program file:
Create a
tablearray by calling thereadtablefunction.Create a sortable and editable table UI component to display in a figure. Store the
tablearray to component'sDataproperty.Specify a
DisplayDataChangedFcncallback that uses theDisplayDataproperty to update the plot when a user sorts columns or edits cells in the table UI component.
function tsunamisData
t = readtable('tsunamis.xlsx');
vars = {'Year','MaxHeight','Latitude','Longitude'};
t = t(1:20,vars);

fig = uifigure;
fig.Position(3:4) = [822 360];

uit = uitable(fig);
uit.Data = t;
uit.ColumnSortable = [false true true true];
uit.ColumnEditable = true;
uit.Position(3) = 375;
uit.DisplayDataChangedFcn = @updatePlot;

ax = uiaxes(fig);
ax.Position(1) = 415;
ax.YLabel.String = 'Max Height';
x = t.Year;
y = t.MaxHeight;
area(ax,x,y)

    function updatePlot(src,event)
        t = uit.DisplayData;
        x = t.Year;
        y = t.MaxHeight;
        area(ax,x,y)
    end

end

A sortable column displays arrows in the header when you hover your mouse over it. Find a sortable column and sort the table. Notice how the displayed data and the plot update after sorting.

Add Style to Specific Cells in Table
Starting in R2019b, you can style rows, columns, or cells of
a table UI component using the uistyle and addStyle functions. Styles are only supported when the table UI
component is in a figure created with the uifigure
function. App Designer uses this type of figure for creating apps.
Style cells in a table UI component that contain missing values. In this
case, add a yellow background color style to cells that have
NaN values.
Read tsunami sample data into the workspace as a table array. Then, create a table UI component to display the data.
tdata = readtable('tsunamis.xlsx');
vars = {'Year','Month','Day','Hour', ...
        'MaxHeight','Cause','EarthquakeMagnitude'};
tdata = tdata(1:100,vars);

fig = uifigure('Position',[500 500 750 350]);
uit = uitable(fig);
uit.Position = [20 20 710 310];
uit.Data = tdata;
uit.RowName = 'numbered';
Use the ismissing function to get a logical array of
the table elements that contain missing values. Find the row and column
subscripts for the elements that have NaN values.
Finally, create a yellow background color style and add it to the cells with
NaN values in the table UI component.
styleIndices = ismissing(tdata);
[row,col] = find(styleIndices);

s = uistyle('BackgroundColor','yellow');
addStyle(uit,s,'cell',[row,col]);

Display Array of Numbers
Create a table UI component that displays a 10-by-3 array of random
integers. The Data property specifies the values to
display, and the Position property specifies the
location and size of the table within the figure.
f = figure;
uit = uitable(f,'Data',randi(100,10,3),'Position',[20 20 262 204]);

Display Mixed Data Types
Table UI components can accommodate a mixture of different data types across the columns.
Create an empty Table UI component.
f = figure;
uit = uitable(f);
Set the Data property to populate the data as a cell
array that contains a mixture of different types. Then set the
Position property to adjust the location and size
of the table to fit the data.
d = {'Male',52,true;'Male',40,true;'Female',25,false};
uit.Data = d;
uit.Position = [20 20 258 78];
Set the ColumnName property to change the column
headings to descriptive names. Set the ColumnEditable
property to true so that users can edit the data in the
UI. When a user changes a value in the UI, the Data
property updates to reflect that change.
uit.ColumnName = {'Gender','Age','Authorized'};
uit.ColumnEditable = true;