Create Live Scripts in the Live Editor
Live scripts are program files that contain your code, output, and formatted text together in a single interactive environment called the Live Editor. In live scripts, you can write your code and view the generated output and graphics along with the code that produced it. Add formatted text, images, hyperlinks, and equations to create an interactive narrative that you can share with others.
Create Live Script
To create a live script in the Live Editor, go to the Home
tab and click New Live Script
![]() . You also can use the
. You also can use the edit
function in the Command Window. For example, type edit penny.mlx
to open or create the file penny.mlx. To ensure that a live
script is created, specify a .mlx extension. If an extension is
not specified, MATLAB® defaults to a file with .m extension, which only
supports plain code.
Open Existing Script as Live Script
If you have an existing script, you can open it as a live script in the Live Editor. Opening a script as a live script creates a copy of the file and leaves the original file untouched. MATLAB converts publishing markup from the original script to formatted content in the new live script.
To open an existing script (.m) as a live script
(.mlx) from the Editor, right-click the document tab, and
select Open scriptName as Live
Script from the context menu. Alternatively, go to the
Editor tab, click
Save![]() , and select Save As.
Then, set the Save as type: to
, and select Save As.
Then, set the Save as type: to MATLAB Live
Code Files (*.mlx) and click
Save.
Note
You must use one of the described conversion methods to convert your
script to a live script. Simply renaming the script with a
.mlx extension does not work and can corrupt the
file.
Add Code
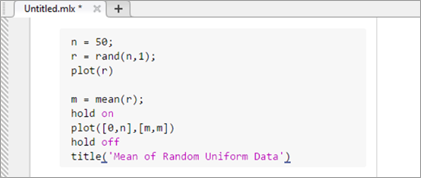
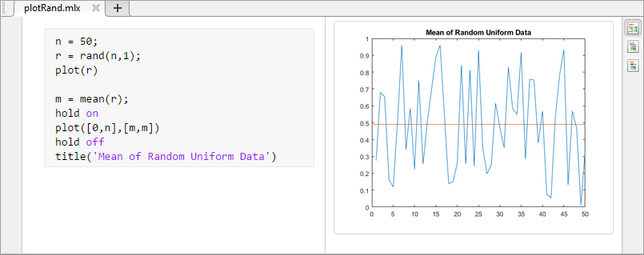
After you create a live script, you can add code and run it. For example, add this code that plots a vector of random data and draws a horizontal line on the plot at the mean.
n = 50;
r = rand(n,1);
plot(r)

m = mean(r);
hold on
plot([0,n],[m,m])
hold off
title('Mean of Random Uniform Data')
By default, MATLAB autocompletes block endings, parentheses, and quotes when entering
code in the Live Editor. For example, type if and then press
Enter. MATLAB automatically adds the end statement.

MATLAB also autocompletes comments, character vectors, strings, and
parentheses when split across two lines. To escape out of an autocompletion, press
Ctrl+Z or the Undo
![]() button. Autocompletions are enabled by default.
To disable them, see Editor/Debugger Autocoding Preferences.
button. Autocompletions are enabled by default.
To disable them, see Editor/Debugger Autocoding Preferences.
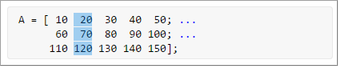
When adding or editing code, you can select and edit a rectangular area of code (also known as column selection or block edit). This is useful if you want to copy or delete several columns of data (as opposed to rows), or if you want to edit multiple lines at one time. To select a rectangular area, press the Alt key while making a selection.
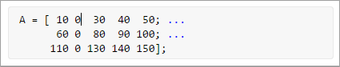
For example, select the second column of data in A.
Type 0 to set all the selected values to 0.
Run Code
To run the code, click the vertical striped bar to the left of the code.
Alternatively, go to the Live Editor tab and click
Run. While your program is running, a status indicator
![]() appears at the top left of the Editor window. A
gray blinking bar to the left of a line of code indicates the line that MATLAB is evaluating. To navigate to the line MATLAB is evaluating, click the status indicator.
appears at the top left of the Editor window. A
gray blinking bar to the left of a line of code indicates the line that MATLAB is evaluating. To navigate to the line MATLAB is evaluating, click the status indicator.
If an error occurs while MATLAB is running your program or if MATLAB detects a significant issue in your code, the status indicator becomes
an error icon ![]() . To navigate to the error, click the icon. An
error icon
. To navigate to the error, click the icon. An
error icon ![]() to the right of the line of code indicates the
error. The corresponding error message is displayed as an output.
to the right of the line of code indicates the
error. The corresponding error message is displayed as an output.
You do not need to save your live script to run it. When you do save your live
script, MATLAB automatically saves it with a .mlx extension. For
example, go the Live Editor tab, click
![]() Save, and enter the name
Save, and enter the name plotRand.
MATLAB saves the live script as plotRand.mlx.
Display Output
By default, MATLAB displays output to the right of the code. Each output is displayed with the line that creates it, like in the Command Window.
You can change the size of the output display panel by dragging left or right on the resizer bar between the code and output.
To clear an output, right-click the output or the code line that created it, and select Clear Output. To clear all output, right-click anywhere in the script and select Clear All Output. Alternatively, go to the View tab and in the Output section, click the Clear all Output button.
When scrolling, MATLAB aligns the output to the code that generates it. To disable the alignment of output to code, right-click the output section and select Disable Synchronous Scrolling.
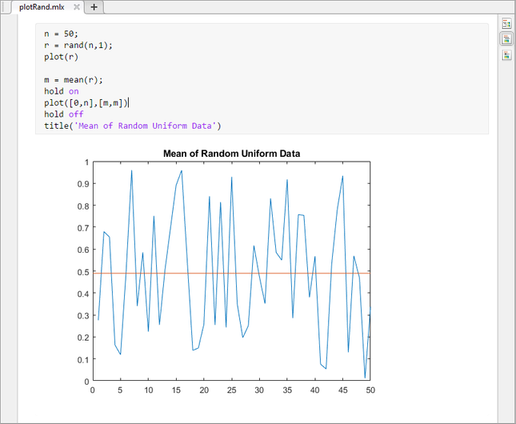
To move the output in line with the code, click the ![]() output inline button to the right of the live
script. You also can go to the View tab and in the
View section, click the
output inline button to the right of the live
script. You also can go to the View tab and in the
View section, click the ![]() Output Inline button.
Output Inline button.
To only display output, controls, and formatted text and hide the code, click the
hide code ![]() button. To show the code again, click the output
inline
button. To show the code again, click the output
inline ![]() button or the output on right
button or the output on right
![]() button.
button.
To modify figures in the output, use the tools in the upper-right corner of the figure axes or in the Figure toolstrip. You can use the tools to explore the data in a figure and add formatting and annotations. For more information, see Modify Figures in Live Scripts.
To open individual outputs, such as variables and figures, in a separate window,
click the ![]() button in the upper right corner of the output.
Variables open in the Variables editor, and figures open in a new figure window.
Changes made to variables or figures outside of a live script do not apply to the
output displayed in the live script.
button in the upper right corner of the output.
Variables open in the Variables editor, and figures open in a new figure window.
Changes made to variables or figures outside of a live script do not apply to the
output displayed in the live script.
Format Text
You can add formatted text, hyperlinks, images, and equations to your live scripts
to create a presentable document to share with others. For example, add a title and
some introductory text to plotRand.mlx:
Place your cursor at the top of the live script and, in the Live Editor tab, select
 Text. A new text line appears above the
code.
Text. A new text line appears above the
code.Click
 and select
Title.Add the text
Plot Random Data.With your cursor still in the line, click the
 button to center the text.
Press Enter to move to the next line.
Type the text
This script plots a vector of
                                random data and draws a horizontal line on the plot at the
                                mean.
For more information including a list of all available formatting options, see Format Files in the Live Editor.

To adjust the displayed font size in the Live Editor, use the Ctrl + Mouse Scroll keyboard shortcut. The change in the displayed font size is not honored when exporting the live script to PDF, Microsoft® Word, HTML, or LaTeX.
Save Live Scripts as Plain Code
To save a live script as a plain code file (.m):
On the Live Editor tab, in the File section, select Save > Save As....
In the dialog box that appears, select
MATLAB Code files
                            (UTF-8) (*.m)
as the Save as type.Click Save.
When saving, MATLAB converts all formatted content to publish markup.