Generate HDL for Mealy and Moore Finite State Machines
Overview
Stateflow® charts support modeling of three types of state machines:
Classic (default)
Mealy
Moore
Mealy and Moore state machines differ in the following ways:
The outputs of a Mealy state machine are a function of the current state and inputs.
The outputs of a Moore state machine are a function of the current state only.
The principal advantages of using Mealy or Moore charts as an alternative to Classic charts are:
Moore charts generate more efficient code than Classic charts.
At compile time, Mealy and Moore charts are validated for conformance to their formal definitions and semantic rules, and violations are reported.
To learn more about HDL code generation guidelines for charts, see Chart (Stateflow).
Open the hdlcoder_fsm_mealy_moore model for an
example that shows how to model Mealy and Moore charts.
Generating HDL Code for a Moore Finite State Machine
When generating HDL code for a chart that models a Moore state machine:
The chart must meet the general code generation requirements as described in Chart (Stateflow).
Actions must occur in states only. These actions must be unlabeled.
Moore actions must be associated with states, because output computation must be dependent only on states, not input. The configuration of active states at time step
tdetermines output. If stateSis active when a chart wakes up at timet, it contributes to the output whether or not it remains active into timet+1.Do not call Simulink® functions.
This prevents output from depending on input in ways that would be difficult for the HDL code generator to verify.
Make sure that you enable the chart property Initialize Outputs Every Time Chart Wakes Up as shown in the figure.
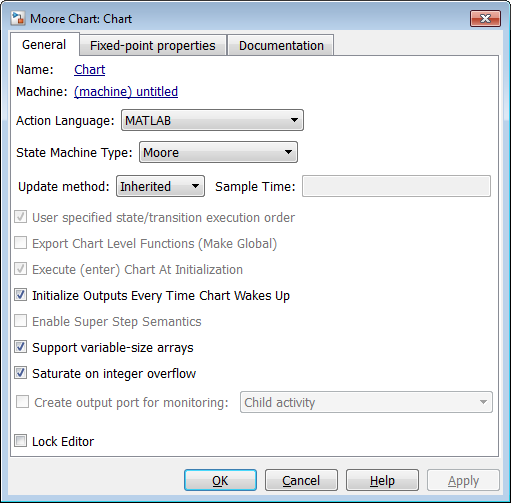
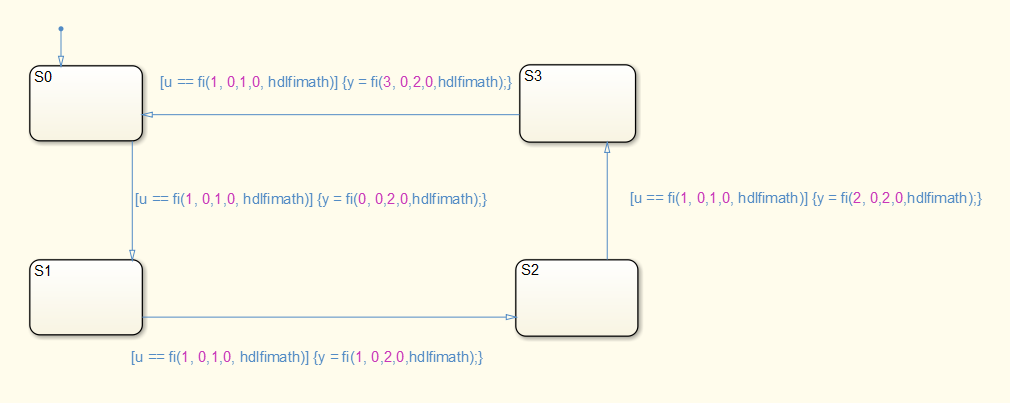
The following figure shows a Stateflow chart of a Moore state machine that uses MATLAB® as the action language.

The Verilog® code generated for the Moore chart:
  always @(posedge clk or posedge reset)
    begin : Moore_Chart_1_process
      if (reset == 1'b1) begin
        is_Moore_Chart <= is_Moore_Chart_IN_S0;
      end
      else begin
        if (enb) begin
          case ( is_Moore_Chart)
            is_Moore_Chart_IN_S0 :
              begin
                if (u == 8'sb00000001) begin
                  is_Moore_Chart <= is_Moore_Chart_IN_S1;
                end
              end
            is_Moore_Chart_IN_S1 :
              begin
                if (u == 8'sb00000001) begin
                  is_Moore_Chart <= is_Moore_Chart_IN_S2;
                end
              end
            is_Moore_Chart_IN_S2 :
              begin
                if (u == 8'sb00000001) begin
                  is_Moore_Chart <= is_Moore_Chart_IN_S3;
                end
              end
            default :
              begin
                if (u == 8'sb00000001) begin
                  is_Moore_Chart <= is_Moore_Chart_IN_S0;
                end
              end
          endcase
        end
      end
    end

  always @(is_Moore_Chart) begin
    y_1 = 2'b00;
    case ( is_Moore_Chart)
      is_Moore_Chart_IN_S0 :
        begin
          y_1 = 2'b00;
        end
      is_Moore_Chart_IN_S1 :
        begin
          y_1 = 2'b01;
        end
      is_Moore_Chart_IN_S2 :
        begin
          y_1 = 2'b10;
        end
      default :
        begin
          y_1 = 2'b11;
        end
    endcase
  end

  assign y = y_1;
For an example that shows Mealy and Moore state machines that are
appropriate for HDL code generation, open the hdlcoder_fsm_mealy_moore model.
Generating HDL for a Mealy Finite State Machine
When generating HDL code for a chart that models a Mealy state machine:
The chart must meet the general code generation requirements as described in Chart (Stateflow).
Actions must be associated with inner and outer transitions only.
For better synthesis results and more readable HDL code, we recommend enabling the chart property Initialize Outputs Every Time Chart Wakes Up, as shown in the following figure. If you disable Initialize Outputs Every Time Chart Wakes Up, the chart output is persistent, so the generated HDL code must internally register the output values.

Mealy actions are associated with transitions. In Mealy machines, output computation is expected to be driven by the change on inputs. In fact, the dependence of output on input is the fundamental distinguishing factor between the formal definitions of Mealy and Moore machines. The requirement that actions be given on transitions is to some degree stylistic, rather than required, to enforce Mealy semantics. However, it is natural that output computation follows input conditions on input, because transition conditions are primarily input conditions in any machine type.
The following figure shows an example of a chart that models a Mealy state machine using MATLAB as the action language.
The Verilog code generated for the Mealy chart:
  always @(posedge clk or posedge reset)
    begin : Mealy_Chart_1_process
      if (reset == 1'b1) begin
        is_Mealy_Chart <= is_Mealy_Chart_IN_S0;
      end
      else begin
        if (enb) begin
          is_Mealy_Chart <= is_Mealy_Chart_next;
        end
      end
    end

  always @(is_Mealy_Chart, u) begin
    is_Mealy_Chart_next = is_Mealy_Chart;
    y_1 = 2'b00;
    case ( is_Mealy_Chart)
      is_Mealy_Chart_IN_S0 :
        begin
          if (u == 8'sb00000001) begin
            y_1 = 2'b00;
            is_Mealy_Chart_next = is_Mealy_Chart_IN_S1;
          end
        end
      is_Mealy_Chart_IN_S1 :
        begin
          if (u == 8'sb00000001) begin
            y_1 = 2'b01;
            is_Mealy_Chart_next = is_Mealy_Chart_IN_S2;
          end
        end
      is_Mealy_Chart_IN_S2 :
        begin
          if (u == 8'sb00000001) begin
            y_1 = 2'b10;
            is_Mealy_Chart_next = is_Mealy_Chart_IN_S3;
          end
        end
      default :
        begin
          if (u == 8'sb00000001) begin
            y_1 = 2'b11;
            is_Mealy_Chart_next = is_Mealy_Chart_IN_S0;
          end
        end
    endcase
  end

  assign y = y_1;
For an example that shows Mealy and Moore state machines that are
appropriate for HDL code generation, open the hdlcoder_fsm_mealy_moore model.
See Also
Chart (Stateflow)