timeline
Display invocations of code sections over execution timeline
Description
timeline( displays
invocations of each profiled code section over the execution timeline.executionProfile)
timeline( specifies
the maximum increment by which you:executionProfile, 'MaxResizeIncrement', numberOfPoints)
Increase the number of displayed points when you click the zoom-out tool.
Move along the
timelineplot when you sweep right or left with the pan tool.
Use this command when you want to review large timeline plots
quickly.
Examples
Display Code Section Invocations
Run a simulation with a model that is configured to generate a workspace variable with execution-time measurements.
rtwdemo_sil_topmodel;
set_param('rtwdemo_sil_topmodel',...
          'CodeExecutionProfiling', 'on');
set_param('rtwdemo_sil_topmodel',...
          'SimulationMode', 'software-in-the-loop (SIL)');
set_param('rtwdemo_sil_topmodel',...
          'CodeProfilingInstrumentation', 'Detailed');
set_param('rtwdemo_sil_topmodel',...
          'CodeProfilingSaveOptions', 'AllData');
sim('rtwdemo_sil_topmodel');
executionProfile
(default).At the end of the simulation, open a code execution report.
report(executionProfile)
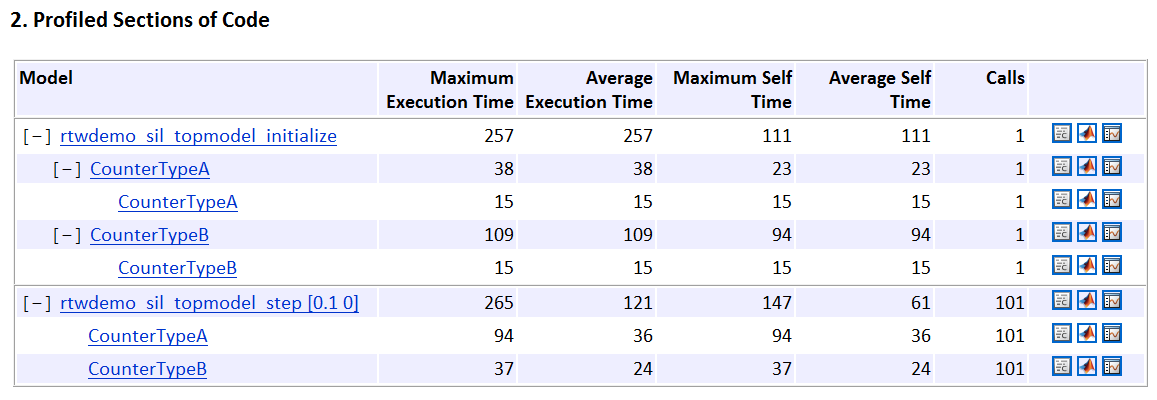
Under Profiled Sections of Code,
in the Model column, expand all
nodes. You see profile information for eight code sections. For example,
the task rtwdemo_sil_topmodel_step and functions CounterTypeA and CounterTypeB.
Display code section invocations.
timeline(executionProfile)
In the Execution Profile window, you see numbered horizontal bars that represent invocations of the code sections.

For example,
the blue bars show when the first section, rtwdemo_sil_topmodel_initialize,
is invoked.
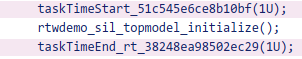
To see the first code section, in the first row of the
Code Execution Profiling Report, click the icon ![]() .
.
The Code Generation Report displays the function call.
To see what code sections are invoked over a specific
time period, use the Start and Range fields
of the Execution Profile window. For example, in the Start and Range fields,
enter 6e-07 and 2e-07 respectively.
Then press Enter.
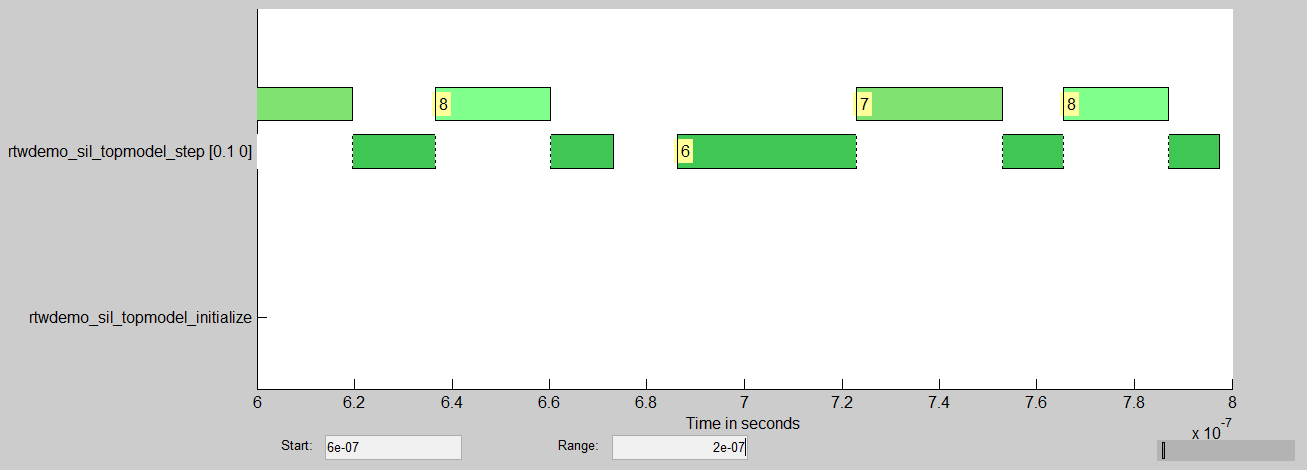
Between 0.6 μs and 0.8 μs, you see that the task rtwdemo_sil_topmodel_step (code
section 6) and the functions CounterTypeA (code
section 7) and CounterTypeB (code section 8) are
invoked.
On the bottom right of the Execution Profile window, the indicator shows what portion of the execution timeline is being displayed.