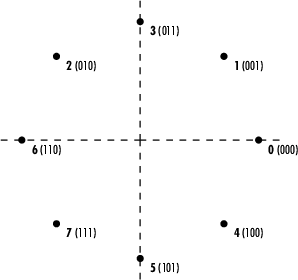
Gray Coded 8-PSK
This model, doc_gray_code, shows a communications link using Gray-coded 8-PSK modulation. Gray coding is a technique often used in multilevel modulation schemes to minimize the bit error rate by ordering modulation symbols so that the binary representations of adjacent symbols differ by only one bit.
Structure of the Example
The example model includes these blocks:
The Random Integer Generator block serves as the source, producing a sequence of integers.
The Integer to Bit Converter block converts each integer into a corresponding binary representation.
The AWGN Channel block adds white Gaussian noise to the modulated data.
The M-PSK Demodulator Baseband block demodulates the corrupted data.
The Bit to Integer Converter block converts each binary representation to a corresponding integer.
One copy of the Error Rate Calculation block (labeled
Error
                                                  Rate Calculation1
in this model) compares the demodulated integer data with the original source data, yielding symbol error statistics. The output of the Error Rate Calculation block is a three-element vector containing the calculated error rate, the number of errors observed, and the amount of data processed.Another copy of the Error Rate Calculation library block (labeled
Error Rate Calculation2in this model) compares the demodulated binary data with the binary representations of the source data, yielding bit error statistics.
Gray-Coded M-PSK Modulation
In this model, the M-PSK Modulator Baseband block:
Accepts binary-valued inputs that represent integers between 0 and M − 1, where M is the alphabet size
Maps binary representations to constellation points using a Gray-coded ordering
Produces unit-magnitude complex phasor outputs, with evenly spaced phases between 0 and 2π(M − 1)/M

The table indicates which binary representations in the input correspond to which phasors in the output. The second column of the table is an intermediate representation that the block uses in its computations.
| Modulator Input | Gray-Coded Ordering | Modulator Output |
|---|---|---|
000 | 0 | exp(0) = 1 |
001 | 1 | exp(jπ/4) |
010 | 3 | exp(j3π/4) |
011 | 2 | exp(j2π/4)
=
exp(jπ/2) |
100 | 7 | exp(j7π/4) |
101 | 6 | exp(j6π/4)
=
exp(j3π/2) |
110 | 4 | exp(j4π/4)
=
exp(jπ) |
111 | 5 | exp(j5π/4) |
The table below sorts the first two columns of the table above, according to the output values. This sorting makes it clearer that the overall effect of this subsystem is a Gray code mapping, as shown in the figure below. Notice that the numbers in the second column of the table below appear in counterclockwise order in the figure.
| Modulator Output | Modulator Input |
|---|---|
exp(0) | 000 |
exp(jπ/4) | 001 |
exp(j2π/4)
=
exp(jπ/2) | 011 |
exp(j3π/4) | 010 |
exp(j4π/4)
=
exp(jπ) | 110 |
exp(j5π/4) | 111 |
exp(j6π/4)
=
exp(j3π/2) | 101 |
exp(j7π/4) | 100 |

Exploring the Example
You can analyze the data that the example produces to compare theoretical performance with simulation performance.
The theoretical symbol error probability of MPSK is
where erfc is the complementary error function,
Es/N0
is the ratio of energy in a symbol to noise power spectral density,
and M is the number of symbols.
To determine the bit error probability, the symbol error probability, PE, needs to be converted to its bit error equivalent. There is no general formula for the symbol to bit error conversion. Upper and lower limits are nevertheless easy to establish. The actual bit error probability, Pb, can be shown to be bounded by
The lower limit corresponds to the case where the symbols have undergone Gray coding. The upper limit corresponds to the case of pure binary coding.
Simulation Results
To test the Gray code modulation scheme in this model, simulate the
graycode model for a range of
Eb/N0
values. If you want to study bit error rates but not symbol error
rates, then you can use the bertool
graphical user interface as described in BERTool.
The rest of this section studies both the bit and symbol error rates
and hence does not use bertool.
Because increasing the value of Eb/N0 lowers the number of errors produced, the length of each simulation must be increased to ensure that the statistics of the errors remain stable.
Using the sim (Simulink) command to
run a Simulink® simulation
from the MATLAB® command
window, the following code generates data for symbol error rate and
bit error rate curves. It considers
Eb/N0
values in the range 0 dB to 12 dB, in steps of 2 dB.
M       = 8;
Tsym    = 0.2;
BERVec  = [];
SERVec  = [];
EbNoVec = [0:2:12];
for n   = 1:length(EbNoVec);
    EbNo = EbNoVec(n);
    sim('doc_gray_code')  ;
    SERVec(n,:) = graySER;
    BERVec(n,:) = grayBER;
end;
After simulating for the full set of Eb/N0 values, you can plot the results using these commands:
semilogy( EbNoVec,SERVec(:,1), 'o', EbNoVec, BERVec(:,1), '*' );
legend  ( 'Symbol error rate', 'Bit error rate' );
xlabel  ( 'Eb/No (dB)' ); ylabel( 'Error Probability' );
title   ( 'Symbol and Bit Error Probability' );

Comparison with Pure Binary Coding and Theory
As a further exercise, using data obtained from berawgn, you can
plot the theoretical curves on the same axes with the simulation
results. You can also compare Gray coding with pure binary coding,
by modifying the M-PSK Modulator Baseband and
M-PSK Demodulator Baseband blocks so that
their Constellation ordering parameters are
Binary instead of
Gray.