Bit Error Rate (BER)
Theoretical Results
Common Notation
The following notation is used throughout this Appendix:
| Quantity or Operation | Notation |
|---|---|
| Size of modulation constellation |
|
| Number of bits per symbol |
|
| Energy per bit-to-noise power-spectral-density ratio |
|
| Energy per symbol-to-noise power-spectral-density ratio |
|
| Bit error rate (BER) |
|
| Symbol error rate (SER) |
|
| Real part |
|
| Largest integer smaller than |
|
The following mathematical functions are used:
| Function | Mathematical Expression |
|---|---|
| Q function |
|
| Marcum Q function |
|
| Modified Bessel function of the first kind of order |
where
is the gamma function. |
| Confluent hypergeometric function |
where the Pochhammer symbol, , is defined as , . |
The following acronyms are used:
| Acronym | Definition |
|---|---|
| M-PSK | M-ary phase-shift keying |
| DE-M-PSK | Differentially encoded M-ary phase-shift keying |
| BPSK | Binary phase-shift keying |
| DE-BPSK | Differentially encoded binary phase-shift keying |
| QPSK | Quaternary phase-shift keying |
| DE-QPSK | Differentially encoded quadrature phase-shift keying |
| OQPSK | Offset quadrature phase-shift keying |
| DE-OQPSK | Differentially encoded offset quadrature phase-shift keying |
| M-DPSK | M-ary differential phase-shift keying |
| M-PAM | M-ary pulse amplitude modulation |
| M-QAM | M-ary quadrature amplitude modulation |
| M-FSK | M-ary frequency-shift keying |
| MSK | Minimum shift keying |
| M-CPFSK | M-ary continuous-phase frequency-shift keying |
Analytical Expressions Used in berawgn
M-PSK. From equation 8.22 in [2]
The following expression is very close, but not strictly equal, to the exact BER (from [4] and equation 8.29 from [2]):
where , , is the Hamming weight of bits assigned to symbol i, and
Special case of , e.g., BPSK (equation 5.2-57 from [1]):
Special case of , e.g., QPSK (equations 5.2-59 and 5.2-62 from [1]):
DE-M-PSK. , e.g., DE-BPSK (equation 8.36 from [2]):
, e.g., DE-QPSK (equation 8.38 from [2]):
From equation 5 in [3]:
OQPSK. Same BER/SER as QPSK [2].
DE-OQPSK. Same BER/SER as DE-QPSK [3].
M-DPSK. From equation 8.84 in [2]:
The following expression is very close, but not strictly equal, to the exact BER [4]:
where , , is the Hamming weight of bits assigned to symbol i, and
Special case of (equation 8.85 from [2]):
M-PAM. From equations 8.3 and 8.7 in [2], and equation 5.2-46 in [1]:
From [5]:
M-QAM. For square M-QAM, is even (equation 8.10 from [2], and equations 5.2-78 and 5.2-79 from [1]):
From [5]:
For rectangular (non-square) M-QAM, is odd, , , and :
From [5]:
where
and
Orthogonal M-FSK with Coherent Detection. From equation 8.40 in [2] and equation 5.2-21 in [1]:
Nonorthogonal 2-FSK with Coherent Detection. For (from equation 5.2-21 in [1] and equation 8.44 in [2]):
is the complex correlation coefficient:
where and are complex lowpass signals, and
For example:
where .
(from equation 8.44 in [2], where )
Orthogonal M-FSK with Noncoherent Detection. From equation 5.4-46 in [1] and equation 8.66 in [2]:
Nonorthogonal 2-FSK with Noncoherent Detection. For (from equation 5.4-53 in [1] and equation 8.69 in [2]):
where
Precoded MSK with Coherent Detection. Same BER/SER as BPSK.
Differentially Encoded MSK with Coherent Detection. Same BER/SER as DE-BPSK.
MSK with Noncoherent Detection (Optimum Block-by-Block). Upper bound (from equations 10.166 and 10.164 in [6]):
where
CPFSK Coherent Detection (Optimum Block-by-Block). Lower bound (from equation 5.3-17 in [1]):
Upper bound:
where h is the modulation index, and is the number of paths having the minimum distance.
Analytical Expressions Used in berfading
Notation. The following notation is used for the expressions found in
berfading.
| Value | Notation |
|---|---|
| Power of the fading amplitude r | , where denotes statistical expectation |
| Number of diversity branches |
|
| SNR per symbol per branch |
For identically-distributed diversity branches: |
| Moment generating functions for each diversity branch | Rayleigh fading:
Rician fading:
where K is the ratio of energy in the specular component to the energy in the diffuse component (linear scale). For identically-distributed diversity branches: for all l. |
The following acronyms are used:
| Acronym | Definition |
|---|---|
| MRC | maximal-ratio combining |
| EGC | equal-gain combining |
M-PSK with MRC. From equation 9.15 in [2]:
where , , is the Hamming weight of bits assigned to symbol i, and
For the special case of Rayleigh fading with (from equations C-18, C-21, and Table C-1 in [6]):
where
If :
DE-M-PSK with MRC. For (from equations 8.37 and 9.8-9.11 in [2]):
M-PAM with MRC. From equation 9.19 in [2]:
M-QAM with MRC. For square M-QAM, is even (equation 9.21 in [2]):
For rectangular (nonsquare) M-QAM, is odd, , , , , and
M-DPSK with Postdetection EGC. From equation 8.165 in [2]:
where , , is the Hamming weight of bits assigned to symbol i, and
For the special case of Rayleigh fading with , and (equation 8.173 from [2]):
Orthogonal 2-FSK, Coherent Detection with MRC. From equation 9.11 in [2]:
For the special case of Rayleigh fading (equations 14.4-15 and 14.4-21 in [1]):
Nonorthogonal 2-FSK, Coherent Detection with MRC. Equations 9.11 and 8.44 in [2]:
For the special case of Rayleigh fading with (equation 20 in [8] and equation 8.130 in [2]):
Orthogonal M-FSK, Noncoherent Detection with EGC. Rayleigh fading (equation 14.4-47 in [1]):
Rician fading (equation 41 in [8]):
where
and if and 0 otherwise.
Nonorthogonal 2-FSK, Noncoherent Detection with No Diversity. From equation 8.163 in [2]:
where
Analytical Expressions Used in bercoding and BERTool
Common Notation for This Section
| Description | Notation |
|---|---|
| Energy-per-information bit-to-noise power-spectral-density ratio |
|
| Message length | |
| Code length | |
| Code rate |
|
Block Coding. Specific notation for block coding expressions: is the minimum distance of the code.
Soft Decision
BPSK, QPSK, OQPSK, PAM-2, QAM-4, and precoded MSK (equation 8.1-52 in [1]):
DE-BPSK, DE-QPSK, DE-OQPSK, and DE-MSK:
BFSK, coherent detection (equations 8.1-50 and 8.1-58 in [1]):
BFSK, noncoherent square-law detection (equations 8.1-65 and 8.1-64 in [1]):
DPSK:
Hard Decision
General linear block code (equations 4.3, 4.4 in [9], and 12.136 in [6]):
Hamming code (equations 4.11, 4.12 in [9], and 6.72, 6.73 in [7]):
(24, 12) extended Golay code (equation 4.17 in [9], and 12.139 in [6]):
where is the average number of channel symbol errors that remain in corrected N-tuple when the channel caused m symbol errors (table 4.2 in [9]).
Reed-Solomon code with :
for FSK (equations 4.25, 4.27 in [9], 8.1-115, 8.1-116 in [1], 8.7, 8.8 in [7], and 12.142, 12.143 in [6]), and
otherwise.
If where h is an integer (equation 1 in [10]):
where s is the symbol error rate (SER) in an uncoded AWGN channel.
For example, for BPSK, and
Otherwise, is given by table 1 and equation 2 in [10].
Convolutional Coding. Specific notation for convolutional coding expressions: is the free distance of the code, and is the number of paths of distance d from the all-zero path that merge with the all-zero path for the first time.
Soft Decision
From equations 8.2-26, 8.2-24, and 8.2-25 in [1], and equations 13.28 and 13.27 in [6]:
with transfer function
where is the exponent of N as a function of d.
Results for BPSK, QPSK, OQPSK, PAM-2, QAM-4, precoded MSK, DE-BPSK, DE-QPSK, DE-OQPSK, DE-MSK, DPSK, and BFSK are obtained as:
where is the BER in the corresponding uncoded AWGN channel. For example, for BPSK (equation 8.2-20 in [1]):
Hard Decision
From equations 8.2-33, 8.2-28, and 8.2-29 in [1], and equations 13.28, 13.24, and 13.25 in [6]:
where
when d is odd, and
when d is even (p is the bit error rate (BER) in an uncoded AWGN channel).
Performance Results via Simulation
Section Overview
One way to compute the bit error rate or symbol error rate for a communication system is to simulate the transmission of data messages and compare all messages before and after transmission. The simulation of the communication system components using Communications Toolbox™ is covered in other parts of this guide. This section describes how to compare the data messages that enter and leave the simulation.
Another example of computing performance results via simulation is in Curve Fitting for Error Rate Plots in the discussion of curve fitting.
Using Simulated Data to Compute Bit and Symbol Error Rates
The biterr function compares two sets of data and
computes the number of bit errors and the bit error rate. The
symerr function compares two sets of data and computes
the number of symbol errors and the symbol error rate. An error is a discrepancy
between corresponding points in the two sets of data.
Of the two sets of data, typically one represents messages entering a transmitter and the other represents recovered messages leaving a receiver. You might also compare data entering and leaving other parts of your communication system, for example, data entering an encoder and data leaving a decoder.
If your communication system uses several bits to represent one symbol, counting bit errors is different from counting symbol errors. In either the bit- or symbol-counting case, the error rate is the number of errors divided by the total number (of bits or symbols) transmitted.
Note
To ensure an accurate error rate, you should typically simulate enough data to produce at least 100 errors.
If the error rate is very small (for example, 10-6 or smaller), the semianalytic technique might compute the result more quickly than a simulation-only approach. See Performance Results via the Semianalytic Technique for more information on how to use this technique.
Example: Computing Error Rates
The script below uses the symerr function to compute the
symbol error rates for a noisy linear block code. After artificially adding
noise to the encoded message, it compares the resulting noisy code to the
original code. Then it decodes and compares the decoded message to the original
one.
m = 3; n = 2^m-1; k = n-m; % Prepare to use Hamming code.
msg = randi([0 1],k*200,1); % 200 messages of k bits each
code = encode(msg,n,k,'hamming');
codenoisy = rem(code+(rand(n*200,1)>.95),2); % Add noise.
% Decode and correct some errors.
newmsg = decode(codenoisy,n,k,'hamming');
% Compute and display symbol error rates.
noisyVec = step(comm.ErrorRate,code,codenoisy);
decodedVec = step(comm.ErrorRate,msg,newmsg);
disp(['Error rate in the received code: ',num2str(noisyVec(1))])
disp(['Error rate after decoding: ',num2str(decodedVec(1))])
The output is below. The error rate decreases after decoding because the Hamming decoder corrects some of the errors. Your results might vary because this example uses random numbers.
Error rate in the received code: 0.054286
Error rate after decoding: 0.03
Comparing Symbol Error Rate and Bit Error Rate
In the example above, the symbol errors and bit errors are the same because each symbol is a bit. The commands below illustrate the difference between symbol errors and bit errors in other situations.
a = [1 2 3]'; b = [1 4 4]';
format rat % Display fractions instead of decimals.
[snum,srate] = symerr(a,b)

[bnum,brate] = biterr(a,b)
The output is below.
snum =

      2


srate =

     2/3


bnum =

      5


brate =

     5/9
bnum is 5 because the second entries differ in two bits and
the third entries differ in three bits. brate is 5/9 because
the total number of bits is 9. The total number of bits is, by definition, the
number of entries in a or b times the
maximum number of bits among all entries of a and
b.
Performance Results via the Semianalytic Technique
The technique described in Performance Results via Simulation works well for a large variety of communication systems, but can be prohibitively time-consuming if the system's error rate is very small (for example, 10-6 or smaller). This section describes how to use the semianalytic technique as an alternative way to compute error rates. For certain types of systems, the semianalytic technique can produce results much more quickly than a nonanalytic method that uses only simulated data.
The semianalytic technique uses a combination of simulation and analysis to
determine the error rate of a communication system. The
semianalytic function in Communications Toolbox helps you implement the semianalytic technique by performing some of
the analysis.
When to Use the Semianalytic Technique
The semianalytic technique works well for certain types of communication systems, but not for others. The semianalytic technique is applicable if a system has all of these characteristics:
Any effects of multipath fading, quantization, and amplifier nonlinearities must precede the effects of noise in the actual channel being modeled.
The receiver is perfectly synchronized with the carrier, and timing jitter is negligible. Because phase noise and timing jitter are slow processes, they reduce the applicability of the semianalytic technique to a communication system.
The noiseless simulation has no errors in the received signal constellation. Distortions from sources other than noise should be mild enough to keep each signal point in its correct decision region. If this is not the case, the calculated BER is too low. For instance, if the modeled system has a phase rotation that places the received signal points outside their proper decision regions, the semianalytic technique is not suitable to predict system performance.
Furthermore, the semianalytic function assumes that the
noise in the actual channel being modeled is Gaussian. For details on how to
adapt the semianalytic technique for non-Gaussian noise, see the discussion of
generalized exponential distributions in [11].
Procedure for the Semianalytic Technique
The procedure below describes how you would typically implement the
semianalytic technique using the semianalytic
function:
Generate a message signal containing at least ML symbols, where M is the alphabet size of the modulation and L is the length of the impulse response of the channel in symbols. A common approach is to start with an augmented binary pseudonoise (PN) sequence of total length
(log2M)ML. An augmented PN sequence is a PN sequence with an extra zero appended, which makes the distribution of ones and zeros equal.Modulate a carrier with the message signal using baseband modulation. Supported modulation types are listed on the reference page for
semianalytic. Shape the resultant signal with rectangular pulse shaping, using the oversampling factor that you will later use to filter the modulated signal. Store the result of this step astxsigfor later use.Filter the modulated signal with a transmit filter. This filter is often a square-root raised cosine filter, but you can also use a Butterworth, Bessel, Chebyshev type 1 or 2, elliptic, or more general FIR or IIR filter. If you use a square-root raised cosine filter, use it on the nonoversampled modulated signal and specify the oversampling factor in the filtering function. If you use another filter type, you can apply it to the rectangularly pulse shaped signal.
Run the filtered signal through a noiseless channel. This channel can include multipath fading effects, phase shifts, amplifier nonlinearities, quantization, and additional filtering, but it must not include noise. Store the result of this step as
rxsigfor later use.Invoke the
semianalyticfunction using thetxsigandrxsigdata from earlier steps. Specify a receive filter as a pair of input arguments, unless you want to use the function's default filter. The function filtersrxsigand then determines the error probability of each received signal point by analytically applying the Gaussian noise distribution to each point. The function averages the error probabilities over the entire received signal to determine the overall error probability. If the error probability calculated in this way is a symbol error probability, the function converts it to a bit error rate, typically by assuming Gray coding. The function returns the bit error rate (or, in the case of DQPSK modulation, an upper bound on the bit error rate).
Using Semianalytic Technique
The example below illustrates the procedure for the semianalytic technique, using 16-QAM modulation. It also compares the error rates obtained from the semianalytic technique with the theoretical error rates obtained from published formulas and computed using the berawgn function. The resulting plot shows that the error rates obtained using the two methods are nearly identical. The discrepancies between the theoretical and computed error rates are largely due to the phase offset inserted through a noiseless channel model.
Generate message signal of length >= M^L.
M = 16; % Alphabet size of modulation
L = 1; % Length of impulse response of channel
msg = [0:M-1 0]; % M-ary message sequence of length > M^L
Modulate the message signal using baseband modulation.
modsig = qammod(msg',M); % Modulate data
Nsamp = 16;
modsig = rectpulse(modsig,Nsamp); % Use rectangular pulse shaping.
Apply a transmit filter.
txsig = modsig; % No filter in this exampleRun txsig through a noiseless channel.
rxsig = txsig*exp(1i*pi/180); % Static phase offset of 1 degreeUse the semianalytic function.
Specify the receive filter as a pair of input arguments. In this case, num and den describe an ideal integrator.
num = ones(Nsamp,1)/Nsamp;
den = 1;
EbNo = 0:20; % Range of Eb/No values under study
ber = semianalytic(txsig,rxsig,'qam',M,Nsamp,num,den,EbNo);

% For comparison, calculate theoretical BER.
bertheory = berawgn(EbNo,'qam',M);

% Plot computed BER and theoretical BER.
figure; semilogy(EbNo,ber,'k*');
hold on; semilogy(EbNo,bertheory,'ro');
title('Semianalytic BER Compared with Theoretical BER');
legend('Semianalytic BER with Phase Offset',...
    'Theoretical BER Without Phase Offset','Location','SouthWest');
hold off;

Theoretical Performance Results
Computing Theoretical Error Statistics
While the biterr function discussed above can help you
gather empirical error statistics, you might also compare those results to
theoretical error statistics. Certain types of communication systems are
associated with closed-form expressions for the bit error rate or a bound on it.
The functions listed in the table below compute the closed-form expressions for
some types of communication systems, where such expressions exist.
| Type of Communication System | Function |
|---|---|
| Uncoded AWGN channel | berawgn
|
| Coded AWGN channel | bercoding |
| Uncoded Rayleigh and Rician fading channel | berfading
|
| Uncoded AWGN channel with imperfect synchronization | bersync
|
Each function's reference page lists one or more books containing the closed-form expressions that the function implements.
Plotting Theoretical Error Rates
This example uses the bercoding function to compute upper bounds on bit error rates for convolutional coding with a soft-decision decoder.
coderate = 1/4; % Code rateCreate a structure dspec with information about distance spectrum. Define the EbNo sweep range and generate the theoretical bound results.
dspec.dfree = 10; % Minimum free distance of code
dspec.weight = [1 0 4 0 12 0 32 0 80 0 192 0 448 0 1024 ...
    0 2304 0 5120 0]; % Distance spectrum of code
EbNo = 3:0.5:8;
berbound = bercoding(EbNo,'conv','soft',coderate,dspec);
Plot the theoretical bound results.
semilogy(EbNo,berbound)
xlabel('E_b/N_0 (dB)');
ylabel('Upper Bound on BER');
title('Theoretical Bound on BER for Convolutional Coding');
grid on;

References
[1] Proakis, J. G., Digital Communications, 4th Ed., McGraw-Hill, 2001.
[2] Frenger, Pal, Pal Orten, and Tony Ottosson, "Convolutional Codes with Optimum Distance Spectrum," IEEE Communications Letters, Vol. 3, #11, Nov. 1999, pp. 317-319
Comparing Theoretical and Empirical Error Rates
This example uses the berawgn function to compute symbol error rates for pulse amplitude modulation (PAM) with a series of Eb/N0 values. For comparison, the code simulates 8-PAM with an AWGN channel and computes empirical symbol error rates. The code also plots the theoretical and empirical symbol error rates on the same set of axes.
Compute and plot theoretical error rate using berawgn.
rng('default') % Set random number seed for repeatability
M = 8;
EbNo = 0:13;
[ber, ser] = berawgn(EbNo,'pam',M);

semilogy(EbNo,ser,'r');
xlabel('E_b/N_0 (dB)');
ylabel('Symbol Error Rate');
grid on;

Compute empirical error rate by simulating. Define simulation parameters and preallocate variables to save time. Convert from EbNo to SNR. Since No = 2*noiseVariance^2, we must add 3 dB to get SNR. For details, see Proakis' book listed in "Selected Bibliography for Performance Evaluation."
n = 10000; % Number of symbols to process
k = log2(M); % Number of bits per symbol
snr = EbNo+3+10*log10(k);
ynoisy = zeros(n,length(snr));
z = zeros(n,length(snr));
berVec = zeros(3,length(EbNo));
Create objects for an AWGN channel error rate calculator. The error rate calculator is used to compare decoded symbols to the original transmitted symbols.
awgnchan = comm.AWGNChannel('NoiseMethod', 'Signal to noise ratio (SNR)');
errcalc = comm.ErrorRate;
Generate a random data message and apply PAM modulation. Normalize channel to signal power. Loop simulation to generate BERs over the range of SNR values.
x = randi([0 M-1],n,1); % Create message signal.
y = pammod(x,M); % Modulate.
awgnchan.SignalPower = (real(y)' * real(y))/ length(real(y));

for jj = 1:length(snr)
    reset(errcalc)
    awgnchan.SNR = snr(jj); % Assign Channel SNR
    ynoisy(:,jj) = awgnchan(real(y)); % Add AWGN
    z(:,jj) = pamdemod(complex(ynoisy(:,jj)),M); % Demodulate.

    % Compute symbol error rate from simulation.
    berVec(:,jj) = errcalc(x,z(:,jj));
end
Compare theoretical and empirical results.
hold on;
semilogy(EbNo,berVec(1,:),'b.');
legend('Theoretical SER','Empirical SER');
title('Comparing Theoretical and Empirical Error Rates');
hold off;

Error Rate Plots
Section Overview
Error rate plots provide a visual way to examine the performance of a communication system, and they are often included in publications. This section mentions some of the tools you can use to create error rate plots, modify them to suit your needs, and do curve fitting on error rate data. It also provides an example of curve fitting. For more detailed discussions about the more general plotting capabilities in MATLAB®, see the MATLAB documentation set.
Creating Error Rate Plots Using semilogy
In many error rate plots, the horizontal axis indicates
Eb/N0 values in dB and the
vertical axis indicates the error rate using a logarithmic (base 10) scale. To
see an example of such a plot, as well as the code that creates it, see Comparing Theoretical and Empirical Error Rates. The part of that
example that creates the plot uses the semilogy function to
produce a logarithmic scale on the vertical axis and a linear scale on the
horizontal axis.
Other examples that illustrate the use of semilogy are in
these sections:
Using Semianalytic Technique, which also illustrates
Plotting two sets of data on one pair of axes
Adding a title
Adding a legend
Plotting Theoretical Error Rates, which also illustrates
Adding axis labels
Adding grid lines
Curve Fitting for Error Rate Plots
Curve fitting is useful when you have a small or imperfect data set but want
to plot a smooth curve for presentation purposes. The
berfit function in Communications Toolbox offers curve-fitting capabilities that are well suited to the
situation when the empirical data describes error rates at different
Eb/N0 values. This function
enables you to
Customize various relevant aspects of the curve-fitting process, such as the type of closed-form function (from a list of preset choices) used to generate the fit.
Plot empirical data along with a curve that
berfitfits to the data.Interpolate points on the fitted curve between Eb/N0 values in your empirical data set to make the plot smoother looking.
Collect relevant information about the fit, such as the numerical values of points along the fitted curve and the coefficients of the fit expression.
Note
The berfit function is intended for curve fitting or
interpolation, not extrapolation. Extrapolating BER
data beyond an order of magnitude below the smallest empirical BER value is
inherently unreliable.
For a full list of inputs and outputs for berfit, see its reference
page.
Curve Fitting An Error Rate Plot
This example simulates a simple differential binary phase shift keying (DBPSK) communication system and plots error rate data for a series of Eb/N0 values. It uses the berfit function to fit a curve to the somewhat rough set of empirical error rates.
Initialize Simulation Parameters
Specify the input signal message length, modulation order, range of Eb/N0 values to consider, and the minimum number of errors that must occur before the simulation computes an error rate for that Eb/N0 value. Preallocate variables for results and interim results.
For statistically accurate error rate results, the minimum number of errors should be on the order of 100 but this simulation uses a small number of errors to shorten run time and to illustrate how curve fitting can smooth out a rough data set.
siglen = 100000; % Number of bits in each trial
M = 2; % DBPSK is binary.
EbN0vec = 0:5; % Vector of EbN0 values
minnumerr = 5; % Compute BER only after 5 errors occur.
numEbN0 = length(EbN0vec); % Number of EbN0 values

ber = zeros(1,numEbN0); % final BER values
berVec = zeros(3,numEbN0); % Updated BER values
intv = cell(1,numEbN0); % Cell array of confidence intervals
Create an error rate calculator System object™.
errorCalc = comm.ErrorRate;
Simulation Loop
Simulate the DBPSK modulated communication system and compute the BER using a for loop to vary the Eb/N0 value. The inner while loop ensures that a minimum number of bit errors occur for each Eb/N0 value. Error rate statistics are saved for each Eb/N0 value to use when curve fitting and plotting.
% Loop over the vector of EbN0 values.
for jj = 1:numEbN0
    EbN0 = EbN0vec(jj);
    snr = EbN0; % Because of binary modulation
    reset(errorCalc)
    awgnChan.SNR = snr; % Assign Channel SNR

    while (berVec(2,jj) < minnumerr)
        msg = randi([0,M-1],siglen,1); % Generate message sequence
        %        txsig = step(hMod,msg); % Modulate
        txsig = dpskmod(msg,M); % Modulate
        awgnChan.SignalPower = (txsig'*txsig)/length(txsig); % Calculate and assign signal power
        %        rxsig = awgnChan(txsig); % Add noise.
        rxsig = awgn(txsig,snr,'measured'); % Add noise.
        %        decodmsg = step(hDemod, rxsig); % Demodulate.
        decodmsg = dpskdemod(rxsig,M); % Demodulate.
        berVec(:,jj) = errorCalc(msg,decodmsg); % Calculate BER
    end
Use berconfint to compute error rate at a 98% confidence interval for the Eb/N0 value.
    [ber(jj), intv1] = berconfint(berVec(2,jj),berVec(3,jj),0.98);
    intv{jj} = intv1;
    disp(['EbN0 = ' num2str(EbN0) ' dB, ' num2str(berVec(2,jj)) ...
        ' errors, BER = ' num2str(ber(jj))])
end
EbN0 = 0 dB, 18392 errors, BER = 0.18392 EbN0 = 1 dB, 14307 errors, BER = 0.14307 EbN0 = 2 dB, 10190 errors, BER = 0.1019 EbN0 = 3 dB, 6940 errors, BER = 0.0694 EbN0 = 4 dB, 4151 errors, BER = 0.04151 EbN0 = 5 dB, 2098 errors, BER = 0.02098
Use berfit to plot the best fitted curve, interpolating to get a smooth plot. Add confidence intervals to the plot.
fitEbN0 = EbN0vec(1):0.25:EbN0vec(end); % Interpolation values
berfit(EbN0vec,ber,fitEbN0);
hold on;
for jj=1:numEbN0
    semilogy([EbN0vec(jj) EbN0vec(jj)],intv{jj},'g-+');
end
hold off;

BERTool
The command bertool launches the Bit Error
Rate Analysis Tool (BERTool) application.
The application enables you to analyze the bit error rate (BER) performance of communications systems. BERTool computes the BER as a function of signal-to-noise ratio. It analyzes performance either with Monte-Carlo simulations of MATLAB functions and Simulink® models or with theoretical closed-form expressions for selected types of communication systems.
Using BERTool you can:
Generate BER data for a communication system using
Closed-form expressions for theoretical BER performance of selected types of communication systems.
The semianalytic technique.
Simulations contained in MATLAB simulation functions or Simulink models. After you create a function or model that simulates the system, BERTool iterates over your choice of Eb/N0 values and collects the results.
Plot one or more BER data sets on a single set of axes. For example, you can graphically compare simulation data with theoretical results or simulation data from a series of similar models of a communication system.
Fit a curve to a set of simulation data.
Send BER data to the MATLAB workspace or to a file for any further processing you might want to perform.
Note
BERTool is designed for analyzing bit error rates only, not symbol error rates, word error rates, or other types of error rates. If, for example, your simulation computes a symbol error rate (SER), convert the SER to a BER before using the simulation with BERTool.
The following sections describe the Bit Error Rate Analysis Tool (BERTool) and provide examples showing how to use its GUI.
Start BERTool
To open BERTool, type
bertool

The BERTool Environment
Components of BERTool
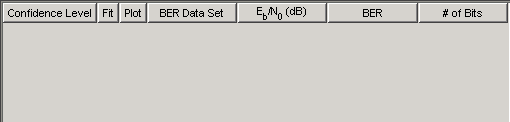
A data viewer at the top. It is initially empty.
After you instruct BERTool to generate one or more BER data sets, they appear in the data viewer. An example that shows how data sets look in the data viewer is in Example: Using a MATLAB Simulation with BERTool.
A set of tabs on the bottom. Labeled Theoretical, Semianalytic, and Monte Carlo, the tabs correspond to the different methods by which BERTool can generate BER data.

Note
When using BERTool to compare theoretical results and Monte Carlo results, the Simulink model provided must model exactly the system defined by the parameters on the Theoretical tab.
To learn more about each of the methods, see
A separate BER Figure window, which displays some or all of the BER data sets that are listed in the data viewer. BERTool opens the BER Figure window after it has at least one data set to display, so you do not see the BER Figure window when you first open BERTool. For an example of how the BER Figure window looks, see Example: Using the Theoretical Tab in BERTool.
Interaction Among BERTool Components. The components of BERTool act as one integrated tool. These behaviors reflect their integration:
If you select a data set in the data viewer, BERTool reconfigures the tabs to reflect the parameters associated with that data set and also highlights the corresponding data in the BER Figure window. This is useful if the data viewer displays multiple data sets and you want to recall the meaning and origin of each data set.
If you click data plotted in the BER Figure window, BERTool reconfigures the tabs to reflect the parameters associated with that data and also highlights the corresponding data set in the data viewer.
Note
You cannot click on a data point while BERTool is generating Monte Carlo simulation results. You must wait until the tool generates all data points before clicking for more information.
If you configure the Semianalytic or Theoretical tab in a way that is already reflected in an existing data set, BERTool highlights that data set in the data viewer. This prevents BERTool from duplicating its computations and its entries in the data viewer, while still showing you the results that you requested.
If you close the BER Figure window, then you can reopen it by choosing BER Figure from the Window menu in BERTool.
If you select options in the data viewer that affect the BER plot, the BER Figure window reflects your selections immediately. Such options relate to data set names, confidence intervals, curve fitting, and the presence or absence of specific data sets in the BER plot.
Note
If you want to observe the integration yourself but do not yet have any data sets in BERTool, then first try the procedure in Example: Using the Theoretical Tab in BERTool.
Note
If you save the BER Figure window using the window's File menu, the resulting file contains the contents of the window but not the BERTool data that led to the plot. To save an entire BERTool session, see Saving a BERTool Session.
Computing Theoretical BERs
Section Overview. You can use BERTool to generate and analyze theoretical BER data. Theoretical data is useful for comparison with your simulation results. However, closed-form BER expressions exist only for certain kinds of communication systems.
To access the capabilities of BERTool related to theoretical BER data, use the following procedure:
Open BERTool, and go to the Theoretical tab.

Set the parameters to reflect the system whose performance you want to analyze. Some parameters are visible and active only when other parameters have specific values. See Available Sets of Theoretical BER Data for details.
Click Plot.
For an example that shows how to generate and analyze theoretical BER data via BERTool, see Example: Using the Theoretical Tab in BERTool.
Also, Available Sets of Theoretical BER Data indicates which combinations of parameters are available on the Theoretical tab and which underlying functions perform computations.
Example: Using the Theoretical Tab in BERTool. This example illustrates how to use BERTool to generate and plot theoretical BER data. In particular, the example compares the performance of a communication system that uses an AWGN channel and QAM modulation of different orders.
Running the Theoretical Example
Open BERTool, and go to the Theoretical tab.
Set the parameters as shown in the following figure.

Click Plot.
BERTool creates an entry in the data viewer and plots the data in the BER Figure window. Even though the parameters request that Eb/N0 go up to 18, BERTool plots only those BER values that are at least 10-8. The following figures illustrate this step.


Change the Modulation order parameter to
16, and click Plot.BERTool creates another entry in the data viewer and plots the new data in the same BER Figure window (not pictured).
Change the Modulation order parameter to
64, and click Plot.BERTool creates another entry in the data viewer and plots the new data in the same BER Figure window, as shown in the following figures.


To recall which value of Modulation order corresponds to a given curve, click the curve. BERTool responds by adjusting the parameters in the Theoretical tab to reflect the values that correspond to that curve.
To remove the last curve from the plot (but not from the data viewer), clear the check box in the last entry of the data viewer in the Plot column. To restore the curve to the plot, select the check box again.
Available Sets of Theoretical BER Data. BERTool can generate a large set of theoretical bit-error rates, but not all combinations of parameters are currently supported. The Theoretical tab adjusts itself to your choices, so that the combination of parameters is always valid. You can set the Modulation order parameter by selecting a choice from the menu or by typing a value in the field. The Normalized timing error must be between 0 and 0.5.
BERTool assumes that Gray coding is used for all modulations.
For QAM, when is odd (M being the modulation order), a rectangular constellation is assumed.
Combinations of Parameters for AWGN Channel Systems
The following table lists the available sets of theoretical BER data for systems that use an AWGN channel.
| Modulation | Modulation Order | Other Choices |
|---|---|---|
| PSK | 2, 4 | Differential or nondifferential encoding. |
| 8, 16, 32, 64, or a higher power of 2 | ||
| OQPSK | 4 | Differential or nondifferential encoding. |
| DPSK | 2, 4, 8, 16, 32, 64, or a higher power of 2 | |
| PAM | 2, 4, 8, 16, 32, 64, or a higher power of 2 | |
| QAM | 4, 8, 16, 32, 64, 128, 256, 512, 1024, or a higher power of 2 | |
| FSK | 2 | Orthogonal or nonorthogonal; Coherent
or Noncoherent demodulation. |
| 4, 8, 16, 32, or a higher power of 2 | Orthogonal;
Coherent demodulation. | |
| 4, 8, 16, 32, or 64 | Orthogonal;
Noncoherent demodulation. | |
| MSK | 2 | Coherent
conventional or precoded MSK; Noncoherent
precoded MSK. |
| CPFSK | 2, 4, 8, 16, or a higher power of 2 | Modulation index
> 0. |
BER results are also available for the following:
block and convolutional coding with hard-decision decoding for all modulations except CPFSK
block coding with soft-decision decoding for all binary modulations (including 4-PSK and 4-QAM) except CPFSK, noncoherent non-orthogonal FSK, and noncoherent MSK
convolutional coding with soft-decision decoding for all binary modulations (including 4-PSK and 4-QAM) except CPFSK
uncoded nondifferentially-encoded 2-PSK with synchronization errors
For more information about specific combinations of parameters, including bibliographic references that contain closed-form expressions, see the reference pages for the following functions:
Combinations of Parameters for Rayleigh and Rician Channel Systems
The following table lists the available sets of theoretical BER data for systems that use a Rayleigh or Rician channel.
When diversity is used, the SNR on each diversity branch is derived from
the SNR at the input of the channel (EbNo) divided by the
diversity order.
| Modulation | Modulation Order | Other Choices |
|---|---|---|
| PSK | 2 | Differential or nondifferential encoding
In the case of nondifferential encoding, diversity order being 1, and Rician fading, a value for RMS phase noise (in radians) can be specified. |
| 4, 8, 16, 32, 64, or a higher power of 2 | Diversity order
≧1 | |
| OQPSK | 4 | Diversity order ≧1 |
| DPSK | 2, 4, 8, 16, 32, 64, or a higher power of 2 | Diversity order
≧1 |
| PAM | 2, 4, 8, 16, 32, 64, or a higher power of 2 | Diversity order ≧1 |
| QAM | 4, 8, 16, 32, 64, 128, 256, 512, 1024, or a higher power of 2 | Diversity order ≧1 |
| FSK | 2 | Correlation coefficient .
In the case of a nonzero correlation coefficient and noncoherent demodulation, the diversity order is 1 only. |
| 4, 8, 16, 32, or a higher power of 2 | Noncoherent demodulation only.
Diversity
                                                order
≧1 |
For more information about specific combinations of parameters, including
bibliographic references that contain closed-form expressions, see the
reference page for the berfading function.
Using the Semianalytic Technique to Compute BERs
Section Overview. You can use BERTool to generate and analyze BER data via the semianalytic technique. The semianalytic technique is discussed in Performance Results via the Semianalytic Technique, and When to Use the Semianalytic Technique is particularly relevant as background material.
To access the semianalytic capabilities of BERTool, open the Semianalytic tab.

For further details about how BERTool applies the semianalytic technique,
see the reference page for the semianalytic function, which
BERTool uses to perform computations.
Example: Using the Semianalytic Tab in BERTool. This example illustrates how BERTool applies the semianalytic technique,
using 16-QAM modulation. This example is a variation on the example in Using Semianalytic Technique, but it is tailored
to use BERTool instead of using the semianalytic function
directly.
Running the Semianalytic Example
Set up the transmitted and received signals. Generate message signal of length >= ML. Modulate the message signal using baseband modulation. Apply pulse shaping with no further transmit filtering. Pass the transmission signal through a noiseless channel.
M = 16; % Alphabet size of modulation
L = 1; % Length of impulse response of channel
msg = [0:M-1 0]; % M-ary message sequence of length > M^L

modsig = qammod(msg,M); % Use 16-QAM.

Nsamp = 16;
modsig = rectpulse(modsig,Nsamp); % Use rectangular pulse shaping.
txsig = modsig; % No filter in this example

rxsig = txsig*exp(j*pi/180); % Static phase offset of 1 degree
Open BERTool and go to the Semianalytic tab.
Set parameters as shown in the following figure.

Click Plot.
Visible Results of the Semianalytic Example
After you click Plot, BERTool creates a listing for the resulting data in the data viewer.
![]()
BERTool plots the data in the BER Figure window.

Procedure for Using the Semianalytic Tab in BERTool. The procedure below describes how you typically implement the semianalytic technique using BERTool:
Generate a message signal containing at least ML symbols, where M is the alphabet size of the modulation and L is the length of the impulse response of the channel in symbols. A common approach is to start with an augmented binary pseudonoise (PN) sequence of total length
(log2M)ML. An augmented PN sequence is a PN sequence with an extra zero appended, which makes the distribution of ones and zeros equal.Modulate a carrier with the message signal using baseband modulation. Supported modulation types are listed on the reference page for
semianalytic. Shape the resultant signal with rectangular pulse shaping, using the oversampling factor that you will later use to filter the modulated signal. Store the result of this step astxsigfor later use.Filter the modulated signal with a transmit filter. This filter is often a square-root raised cosine filter, but you can also use a Butterworth, Bessel, Chebyshev type 1 or 2, elliptic, or more general FIR or IIR filter. If you use a square-root raised cosine filter, use it on the nonoversampled modulated signal and specify the oversampling factor in the filtering function. If you use another filter type, you can apply it to the rectangularly pulse shaped signal.
Run the filtered signal through a noiseless channel. This channel can include multipath fading effects, phase shifts, amplifier nonlinearities, quantization, and additional filtering, but it must not include noise. Store the result of this step as
rxsigfor later use.On the Semianalytic tab of BERTool, enter parameters as in the table below.
Parameter Name Meaning Eb/No range A vector that lists the values of Eb/N0 for which you want to collect BER data. The value in this field can be a MATLAB expression or the name of a variable in the MATLAB workspace. Modulation type These parameters describe the modulation scheme you used earlier in this procedure. Modulation order Differential encoding This check box, which is visible and active for MSK and PSK modulation, enables you to choose between differential and nondifferential encoding. Samples per symbol The number of samples per symbol in the transmitted signal. This value is also the sampling rate of the transmitted and received signals, in Hz. Transmitted signal The txsigsignal that you generated earlier in this procedureReceived signal The rxsigsignal that you generated earlier in this procedureNumerator Coefficients of the receiver filter that BERTool applies to the received signal Denominator Note
Consistency among the values in the GUI is important. For example, if the signal referenced in the Transmitted signal field was generated using DPSK and you set Modulation type to
MSK, the results might not be meaningful.Click Plot.
Semianalytic Computations and Results
After you click Plot, BERTool performs these tasks:
Filters
rxsigand then determines the error probability of each received signal point by analytically applying the Gaussian noise distribution to each point. BERTool averages the error probabilities over the entire received signal to determine the overall error probability. If the error probability calculated in this way is a symbol error probability, BERTool converts it to a bit error rate, typically by assuming Gray coding. (If the modulation type is DQPSK or cross QAM, the result is an upper bound on the bit error rate rather than the bit error rate itself.)Enters the resulting BER data in the data viewer of the BERTool window.
Plots the resulting BER data in the BER Figure window.
Run MATLAB Simulations
Section Overview. You can use BERTool in conjunction with your own MATLAB simulation functions to generate and analyze BER data. The MATLAB function simulates the communication system whose performance you want to study. BERTool invokes the simulation for Eb/N0 values that you specify, collects the BER data from the simulation, and creates a plot. BERTool also enables you to easily change the Eb/N0 range and stopping criteria for the simulation.
To learn how to make your own simulation functions compatible with BERTool, see Use Simulation Functions with BERTool.
Example: Using a MATLAB Simulation with BERTool. This example illustrates how BERTool can run a MATLAB simulation function. The function is
viterbisim, one of the demonstration files included
with Communications Toolbox software.
To run this example, follow these steps:
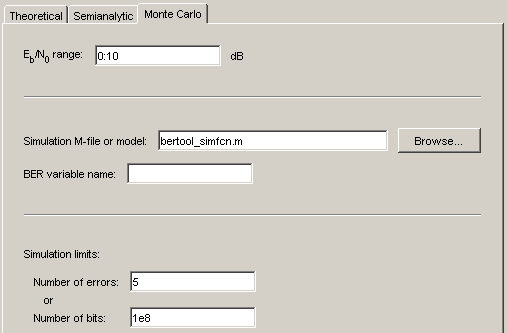
Open BERTool and go to the Monte Carlo tab. (The default parameters depend on whether you have Communications Toolbox software installed. Also note that the BER variable name field applies only to Simulink models.)
Set parameters as shown in the following figure.

Click Run.
BERTool runs the simulation function once for each specified value of Eb/N0 and gathers BER data. (While BERTool is busy with this task, it cannot process certain other tasks, including plotting data from the other tabs of the GUI.)
Then BERTool creates a listing in the data viewer.

BERTool plots the data in the BER Figure window.

To change the range of Eb/N0 while reducing the number of bits processed in each case, type
[5
                                    5.2 5.3]
in the Eb/No range field, type1e5in the Number of bits field, and click Run.BERTool runs the simulation function again for each new value of Eb/N0 and gathers new BER data. Then BERTool creates another listing in the data viewer.

BERTool plots the data in the BER Figure window, adjusting the horizontal axis to accommodate the new data.

The two points corresponding to 5 dB from the two data sets are different because the smaller value of Number of bits in the second simulation caused the simulation to end before observing many errors. To learn more about the criteria that BERTool uses for ending simulations, see Varying the Stopping Criteria.
For another example that uses BERTool to run a MATLAB simulation function, see Example: Prepare a Simulation Function for Use with BERTool.
Varying the Stopping Criteria. When you create a MATLAB simulation function for use with BERTool, you must control the flow so that the simulation ends when it either detects a target number of errors or processes a maximum number of bits, whichever occurs first. To learn more about this requirement, see Requirements for Functions; for an example, see Example: Prepare a Simulation Function for Use with BERTool.
After creating your function, set the target number of errors and the maximum number of bits in the Monte Carlo tab of BERTool.

Typically, a Number of errors value of at least
100 produces an accurate error rate. The
Number of bits value prevents the simulation from
running too long, especially at large values of
Eb/N0. However, if the
Number of bits value is so small that the
simulation collects very few errors, the error rate might not be accurate.
You can use confidence intervals to gauge the accuracy of the error rates
that your simulation produces; the larger the confidence interval, the less
accurate the computed error rate.
As an example, follow the procedure described in Example: Using a MATLAB Simulation with BERTool and set
Confidence Level to
95 for each of the two data sets. The
confidence intervals for the second data set are larger than those for
the first data set. This is because the second data set uses a small
value for Number of bits relative to the
communication system properties and the values in Eb/No
range, resulting in BER values based on only a small
number of observed errors.
Note
You can also use the Stop button in BERTool to stop a series of simulations prematurely, as long as your function is set up to detect and react to the button press.
Plotting Confidence Intervals. After you run a simulation with BERTool, the resulting data set in the
data viewer has an active menu in the Confidence Level
column. The default value is off, so that the
simulation data in the BER Figure window does not show confidence
intervals.
To show confidence intervals in the BER Figure window, set
Confidence Level to a numerical value:
90%, 95%, or
99%.

The plot in the BER Figure window responds immediately to your choice. A sample plot is below.

For an example that plots confidence intervals for a Simulink simulation, see Example: Using a Simulink Model with BERTool.
To find confidence intervals for levels not listed in the
Confidence Level menu, use the berconfint
function.
Fitting BER Points to a Curve. After you run a simulation with BERTool, the BER Figure window plots individual BER data points. To fit a curve to a data set that contains at least four points, select the box in the Fit column of the data viewer.
The plot in the BER Figure window responds immediately to your choice. A sample plot is below.

For an example that performs curve fitting for data from a Simulink simulation and generates the plot shown above, see Example: Using a Simulink Model with BERTool. For an example that performs curve fitting for data from a MATLAB simulation function, see Example: Prepare a Simulation Function for Use with BERTool.
For greater flexibility in the process of fitting a curve to BER data, use
the berfit function.
Use Simulation Functions with BERTool
Requirements for Functions. When you create a MATLAB function for use with BERTool, ensure the function interacts properly with the GUI. This section describes the inputs, outputs, and basic operation of a BERTool-compatible function.
Input Arguments
BERTool evaluates your entries in fields of the GUI and passes data to the function as these input arguments, in sequence:
One value from the Eb/No range vector each time BERTool invokes the simulation function
The Number of errors value
The Number of bits value
Output Arguments
Your simulation function must compute and return these output arguments, in sequence:
Bit error rate of the simulation
Number of bits processed when computing the BER
BERTool uses these output arguments when reporting and plotting results.
Simulation Operation
Your simulation function must perform these tasks:
Simulate the communication system for the Eb/N0 value specified in the first input argument.
Stop simulating when the number of errors or the number of processed bits equals or exceeds the corresponding threshold specified in the second or third input argument, respectively.
Detect whether you click Stop in BERTool and abort the simulation in that case.
Template for a Simulation Function. Use the following template when adapting your code to work with BERTool.
You can open it in an editor by entering edit
bertooltemplate in the MATLAB Command Window. Understanding the Template explains
the template's key sections, while Using the Template indicates how to
use the template with your own simulation code. Alternatively, you can
develop your simulation function without using the template, but be sure it
satisfies the requirements described in Requirements for Functions.
Note
The template is not yet ready for use with BERTool. You must insert
your own simulation code in the places marked INSERT YOUR CODE
HERE. For a complete example based on this template, see
Example: Prepare a Simulation Function for Use with BERTool.
function [ber, numBits] = bertooltemplate(EbNo, maxNumErrs, maxNumBits)
% Import Java class for BERTool.
import com.mathworks.toolbox.comm.BERTool;

% Initialize variables related to exit criteria.
berVec = zeros(3,1); % Updated BER values

% --- Set up parameters. ---
% --- INSERT YOUR CODE HERE.
% Simulate until number of errors exceeds maxNumErrs
% or number of bits processed exceeds maxNumBits.
while((berVec(2) < maxNumErrs) && (berVec(3) < maxNumBits))

   % Check if the user clicked the Stop button of BERTool.
   if (BERTool.getSimulationStop)
      break;
   end

   % --- Proceed with simulation.
   % --- Be sure to update totErr and numBits.
   % --- INSERT YOUR CODE HERE.
end % End of loop

% Assign values to the output variables.
ber = berVec(1);
numBits = berVec(3);
From studying the code in the function template, observe how the function either satisfies the requirements listed in Requirements for Functions or indicates where your own insertions of code should do so. In particular,
The function has appropriate input and output arguments.
The function includes a placeholder for code that simulates a system for the given Eb/N0 value.
The function uses a loop structure to stop simulating when the number of errors exceeds
maxNumErrsor the number of bits exceedsmaxNumBits, whichever occurs first.Note
Although the
whilestatement of the loop describes the exit criteria, your own code inserted into the section markedProceed with simulationmust compute the number of errors and the number of bits. If you do not perform these computations in your own code, clicking Stop is the only way to terminate the loop.In each iteration of the loop, the function detects when the user clicks Stop in BERTool.
Here is a procedure for using the template with your own simulation code:
Determine the setup tasks you must perform. For example, you might want to initialize variables containing the modulation alphabet size, filter coefficients, a convolutional coding trellis, or the states of a convolutional interleaver. Place the code for these setup tasks in the template section marked
Set up parameters.Determine the core simulation tasks, assuming that all setup work has already been performed. For example, these tasks might include error-control coding, modulation/demodulation, and channel modeling. Place the code for these core simulation tasks in the template section marked
Proceed with simulation.Also in the template section marked
Proceed with simulation, include code that updates the values oftotErrandnumBits. The quantitytotErrrepresents the number of errors observed so far. The quantitynumBitsrepresents the number of bits processed so far. The computations to update these variables depend on how your core simulation tasks work.Note
Updating the numbers of errors and bits is important for ensuring that the loop terminates. However, if you accidentally create an infinite loop early in your development work using the function template, click Stop in BERTool to abort the simulation.
Omit any setup code that initializes
EbNo,maxNumErrs, ormaxNumBits, because BERTool passes these quantities to the function as input arguments after evaluating the data entered in the GUI.Adjust your code or the template's code as necessary to use consistent variable names and meanings. For example, if your original code uses a variable called
ebn0and the template's function declaration (first line) uses the variable nameEbNo, you must change one of the names so they match. As another example, if your original code uses SNR instead of Eb/N0, you must convert quantities appropriately.
Example: Prepare a Simulation Function for Use with BERTool. This section adapts the function template given in Template for a Simulation Function.
Preparing the Function
To prepare the function for use with BERTool, follow these steps:
Copy the template from Template for a Simulation Function into a new MATLAB file in the MATLAB Editor. Save it in a folder on your MATLAB path using the file name
bertool_simfcn.From the original example, the following lines are setup tasks. They are modified from the original example to rely on the input arguments that BERTool provides to the function, instead of defining variables such as
EbNovecandnumerrmindirectly.% Set up initial parameters. siglen = 1000; % Number of bits in each trial M = 2; % DBPSK is binary. snr = EbNo; % Because of binary modulation % ErrorRate calculator System object to compare decoded symbols to the % original transmitted symbols. errorCalc = comm.ErrorRate;
Place these lines of code in the template section marked
Set up parameters.From the original example, the following lines are the core simulation tasks, after all setup work has been performed.
msg = randi([0,M-1], siglen, 1); % Generate message sequence. txsig = dpskmod(msg,M); % Modulate. hChan.SignalPower = (txsig'*txsig)/length(txsig); % Calculate and % assign signal power rxsig = awgn(txsig,snr,'measured'); % Add noise. decodmsg = dpskdemod(rxsig,M); % Demodulate. berVec = errorCalc(msg,decodmsg); % Calculate BER
Place the code for these core simulation tasks in the template section marked
Proceed with simulation.
The bertool_simfcn function is now compatible with
BERTool. Note that unlike the original example, the function here does
not initialize EbNovec, define
EbNo as a scalar, or use numerrmin
as the target number of errors; this is because BERTool provides input
arguments for similar quantities. The bertool_simfcn
function also excludes code related to plotting, curve fitting, and
confidence intervals in the original example because BERTool enables you to
do similar tasks interactively without writing code.
Using the Prepared Function
To use bertool_simfcn in conjunction with BERTool,
continue the example by following these steps:
Open BERTool and go to the Monte Carlo tab.
Set parameters on the Monte Carlo tab as shown in the following figure.
Click Run.
BERTool spends some time computing results and then plots them. They do not appear to fall along a smooth curve because the simulation required only five errors for each value in
EbNo.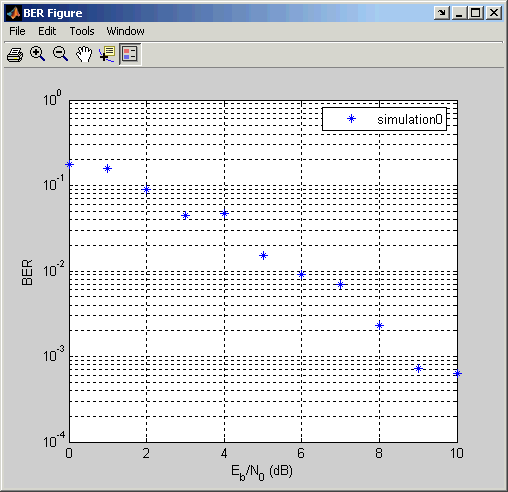
To fit a curve to the series of points in the BER Figure window, select the box next to Fit in the data viewer.
BERTool plots the curve, as shown in the following figure.

Run Simulink Simulations
Section Overview. You can use BERTool in conjunction with Simulink models to generate and analyze BER data. The Simulink model simulates the communication system whose performance you want to study, while BERTool manages a series of simulations using the model and collects the BER data.
Note
To use Simulink models within BERTool, you must have a Simulink license. Communications Toolbox software is highly recommended. The rest of this section assumes you have a license for both Simulink and Communications Toolbox applications.
To access the capabilities of BERTool related to Simulink models, open the Monte Carlo tab.

For further details about confidence intervals and curve fitting for simulation data, see Plotting Confidence Intervals and Fitting BER Points to a Curve, respectively.
Example: Using a Simulink Model with BERTool. This example illustrates how BERTool can manage a series of simulations of
a Simulink model, and how you can vary the plot. The model is
commgraycode, one of the demonstration models
included with Communications Toolbox software. The example assumes that you have Communications Toolbox software installed.
To run this example, follow these steps:
Open BERTool and go to the Monte Carlo tab. The model's file name,
commgraycode.mdl, appears as the Simulation MATLAB file or Simulink model parameter. (Ifviterbisim.mappears there, select to indicate that Communications Toolbox software is installed.)Click Run.
BERTool loads the model into memory (which in turn initializes several variables in the MATLAB workspace), runs the simulation once for each value of Eb/N0, and gathers BER data. BERTool creates a listing in the data viewer.

BERTool plots the data in the BER Figure window.

To fit a curve to the series of points in the BER Figure window, select the box next to Fit in the data viewer.
BERTool plots the curve, as below.
To indicate the 99% confidence interval around each point in the simulation data, set Confidence Level to
99%in the data viewer.BERTool displays error bars to represent the confidence intervals, as below.

Another example that uses BERTool to manage a series of Simulink simulations is in Example: Prepare a Model for Use with BERTool.
Varying the Stopping Criteria. When you create a Simulink model for use with BERTool, you must set it up so that the simulation ends when it either detects a target number of errors or processes a maximum number of bits, whichever occurs first. To learn more about this requirement, see Requirements for Models; for an example, see Example: Prepare a Model for Use with BERTool.
After creating your Simulink model, set the target number of errors and the maximum number of bits in the Monte Carlo tab of BERTool.
Typically, a Number of errors value of at least
100 produces an accurate error rate. The
Number of bits value prevents the simulation from
running too long, especially at large values of
Eb/N0. However, if the
Number of bits value is so small that the
simulation collects very few errors, the error rate might not be accurate.
You can use confidence intervals to gauge the accuracy of the error rates
that your simulation produces; the larger the confidence interval, the less
accurate the computed error rate.
You can also click Stop in BERTool to stop a series of simulations prematurely.
Use Simulink Models with BERTool
Requirements for Models. A Simulink model must satisfy these requirements before you can use it with BERTool, where the case-sensitive variable names must be exactly as shown below:
The channel block must use the variable
EbNorather than a hard-coded value for Eb/N0.The simulation must stop when the error count reaches the value of the variable
maxNumErrsor when the number of processed bits reaches the value of the variablemaxNumBits, whichever occurs first.You can configure the Error Rate Calculation block in Communications Toolbox software to stop the simulation based on such criteria.
The simulation must send the final error rate data to the MATLAB workspace as a variable whose name you enter in the BER variable name field in BERTool. The variable must be a three-element vector that lists the BER, the number of bit errors, and the number of processed bits.
This three-element vector format is supported by the Error Rate Calculation block.
Tips for Preparing Models. Here are some tips for preparing a Simulink model for use with BERTool:
To avoid using an undefined variable name in the dialog box for a Simulink block in the steps that follow, set up variables in the MATLAB workspace using a command such as the one below.
EbNo = 0; maxNumErrs = 100; maxNumBits = 1e8;
You might also want to put the same command in the model's preload function callback, to initialize the variables if you reopen the model in a future MATLAB session.
When you use BERTool, it provides the actual values based on what you enter in the GUI, so the initial values above are somewhat arbitrary.
To model the channel, use the AWGN Channel block in Communications Toolbox software with these parameters:
Mode =
Signal to noise
                                            ratio (Eb/No)
Eb/No =
EbNo

To compute the error rate, use the Error Rate Calculation block in Communications Toolbox software with these parameters:
Check Stop simulation.
Target number of errors =
maxNumErrsMaximum number of symbols =
maxNumBits

To send data from the Error Rate Calculation block to the MATLAB workspace, set Output data to
Port, attach a To Workspace (Simulink) block, and set the latter block's Limit data points to last parameter to1. The Variable name parameter in the To Workspace (Simulink) block must match the value you enter in the BER variable name field of BERTool.Tip
More than one To Workspace (Simulink) block is available. Be sure to select To Workspace (Simulink) from the DSP System Toolbox™ / Sinks sublibrary.
If your model computes a symbol error rate instead of a bit error rate, use the Integer to Bit Converter block in Communications Toolbox software to convert symbols to bits.
Frame-based simulations often run faster than sample-based simulations for the same number of bits processed. The number of errors or number of processed bits might exceed the values you enter in BERTool, because the simulation always processes a fixed amount of data in each frame.
If you have an existing model that uses the AWGN Channel block using a Mode parameter other than
Signal to noise ratio (Eb/No), you can adapt the block to use the Eb/No mode instead. To learn about how the block's different modes are related to each other, press the AWGN Channel block's Help button to view the online reference page.If your model uses a preload function or other callback to initialize variables in the MATLAB workspace upon loading, make sure before you use the Run button in BERTool that one of these conditions is met:
The model is not currently in memory. In this case, BERTool loads the model into memory and runs the callback functions.
The model is in memory (whether in a window or not), and the variables are intact.
If you clear or overwrite the model's variables and want to restore their values before using the Run button in BERTool, you can use the
bdclosefunction in the MATLAB Command Window to clear the model from memory. This causes BERTool to reload the model after you click Run. Similarly, if you refresh your workspace by issuing aclear allorclear variablescommand, you should also clear the model from memory by usingbdclose all.
Example: Prepare a Model for Use with BERTool. This example uses a Simulink model that is set up for use with BERTool. The example also illustrates how to compare the BER performance of a Simulink simulation with theoretical BER results. The example assumes that you have Communications Toolbox software installed.
To prepare the model for use with BERTool, follow these steps, using the exact case-sensitive variable names as shown:
Open the model by entering the following command in the MATLAB Command Window.
doc_bpsk

To initialize parameters in the MATLAB workspace and avoid using undefined variables as block parameters, enter the following command in the MATLAB Command Window.
EbNo = 0; maxNumErrs = 100; maxNumBits = 1e8;
To ensure that BERTool uses the correct amount of noise each time it runs the simulation, open the dialog box for the AWGN Channel block by double-clicking the block. Verify that Es/No is set to
EbNoand click OK. In this particular model, Es/N0 is equivalent to Eb/N0 because the modulation type is BPSK.To ensure that BERTool uses the correct stopping criteria for each iteration,
Open the dialog box for the Error Rate Calculation block. Verify that Target number of errors is set to
maxNumErrs, and that Maximum number of symbols is set tomaxNumBits. Click OK.The simulation stop time must be set to
Inf.
To enable BERTool to access the BER results that the Error Rate Calculation block computes, the To Workspace (Simulink) block,
BER, is connected to the output of the Error Rate Calculation block.Tip
More than one To Workspace (Simulink) block is available. Be sure to select To Workspace (Simulink) from the DSP System Toolbox / Sinks sublibrary.
To use the doc_bpsk model with BERTool, follow these
steps:
Open BERTool and go to the Monte Carlo tab.
Set parameters on the Monte Carlo tab as shown in the following figure.

Click Run.
BERTool spends some time computing results and then plots them.

To compare these simulation results with theoretical results, go to the Theoretical tab in BERTool and set parameters as shown below.

Click Plot.
BERTool plots the theoretical curve in the BER Figure window along with the earlier simulation results.

Manage BER Data
Exporting Data Sets or BERTool Sessions. BERTool enables you to export individual data sets to the MATLAB workspace or to MAT-files. One option for exporting is convenient for processing the data outside BERTool. For example, to create a highly customized plot using data from BERTool, export the BERTool data set to the MATLAB workspace and use any of the plotting commands in MATLAB. Another option for exporting enables you to reimport the data into BERTool later.
BERTool also enables you to save an entire session, which is useful if your session contains multiple data sets that you want to return to in a later session.
This section describes these capabilities:
Exporting Data Sets
To export an individual data set, follow these steps:
In the data viewer, select the data set you want to export.
Choose File > Export Data.

Set Export to to indicate the format and destination of the data.
If you want to reimport the data into BERTool later, you must choose either
Workspace structureorMAT-file structureto create a structure in the MATLAB workspace or a MAT-file, respectively.A new field called Structure name appears. Set it to the name that you want BERTool to use for the structure it creates.
If you selected
Workspace structureand you want BERTool to use your chosen variable name, even if a variable by that name already exists in the workspace, select Overwrite variables.If you do not need to reimport the data into BERTool later, a convenient way to access the data outside BERTool is to have BERTool create a pair of arrays in the MATLAB workspace. One array contains Eb/N0 values, while the other array contains BER values. To choose this option, set Export to to
Workspace arrays.Then type two variable names in the fields under Variable names.
If you want BERTool to use your chosen variable names even if variables by those names already exist in the workspace, select Overwrite variables.
Click OK. If you selected
MAT-file structure, BERTool prompts you for the path to the MAT-file that you want to create.
To reimport a structure later, see Importing Data Sets.
Examining an Exported Structure
This section briefly describes the contents of the structure that BERTool
exports to the workspace or to a MAT-file. The structure's fields are
indicated in the table below. The fields that are most relevant for you when
you want to manipulate exported data are paramsEvaled and
data.
| Name of Field | Significance |
|---|---|
params | The parameter values in the BERTool GUI, some of which might be invisible and hence irrelevant for computations. |
paramsEvaled | The parameter values that BERTool uses when computing the data set. |
data | The Eb/N0, BER, and number of bits processed. |
dataView | Information about the appearance in the data viewer. Used by BERTool for data reimport. |
cellEditabilities | Indicates whether the data viewer has an active Confidence Level or Fit entry. Used by BERTool for data reimport. |
Parameter Fields
The params and paramsEvaled fields
are similar to each other, except that params describes
the exact state of the GUI whereas paramsEvaled indicates
the values that are actually used for computations. As an example of the
difference, for a theoretical system with an AWGN channel,
params records but paramsEvaled
omits a diversity order parameter. The diversity order is not used in the
computations because it is relevant only for systems with Rayleigh channels.
As another example, if you type [0:3]+1 in the GUI as the
range of Eb/N0 values,
params indicates [0:3]+1 while
paramsEvaled indicates 1 2 3
4.
The length and exact contents of paramsEvaled depend on
the data set because only relevant information appears. If the meaning of
the contents of paramsEvaled is not clear upon
inspection, one way to learn more is to reimport the data set into BERTool
and inspect the parameter values that appear in the GUI. To reimport the
structure, follow the instructions in Importing Data Sets or BERTool Sessions.
Data Field
If your exported workspace variable is called ber0, the
field ber0.data is a cell array that contains the
numerical results in these vectors:
ber0.data{1}lists the Eb/N0 values.ber0.data{2}lists the BER values corresponding to each of the Eb/N0 values.ber0.data{3}indicates, for simulation or semianalytic results, how many bits BERTool processed when computing each of the corresponding BER values.
To save an entire BERTool session, follow these steps:
Choose File > Save Session.
When BERTool prompts you, enter the path to the file that you want to create.
BERTool creates a text file that records all data sets currently in the data viewer, along with the GUI parameters associated with the data sets.
Note
If your BERTool session requires particular workspace variables
(such as txsig or rxsig for
the Semianalytic tab), save those separately in
a MAT-file using the save command in
MATLAB.
Importing Data Sets or BERTool Sessions. BERTool enables you to reimport individual data sets that you previously exported to a structure, or to reload entire sessions that you previously saved. This section describes these capabilities:
To learn more about exporting data sets or saving sessions from BERTool, see Exporting Data Sets or BERTool Sessions.
To import an individual data set that you previously exported from BERTool to a structure, follow these steps:
Choose File > Import Data.

Set Import from to either
Workspace structureorMAT-file structure. If you selectWorkspace structure, type the name of the workspace variable in the Structure name field.Click OK. If you select
MAT-file, BERTool prompts you to select the file that contains the structure you want to import.
After you dismiss the Data Import dialog box (and the file selection dialog box, in the case of a MAT-file), the data viewer shows the newly imported data set and the BER Figure window plots it.
Opening a Previous BERTool Session
To replace the data sets in the data viewer with data sets from a previous BERTool session, follow these steps:
Choose File > Open Session.
Note
If BERTool already contains data sets, it asks you whether you want to save the current session. If you answer no and continue with the loading process, BERTool discards the current session upon opening the new session from the file.
When BERTool prompts you, enter the path to the file you want to open. It must be a file that you previously created using the Save Session option in BERTool.
After BERTool reads the session file, the data viewer shows the data sets from the file.
If your BERTool session requires particular workspace variables (such
as txsig or rxsig for the
Semianalytic tab) that you saved separately in
a MAT-file, you can retrieve them using the load
command in MATLAB.
Managing Data in the Data Viewer. The data viewer gives you flexibility to rename and delete data sets, and to reorder columns in the data viewer.
To rename a data set in the data viewer, double-click its name in the BER Data Set column and type a new name.

To delete a data set from the data viewer, select it and choose Edit > Delete.
Note
If the data set originated from the Semianalytic or Theoretical tab, BERTool deletes the data without asking for confirmation. You cannot undo this operation.
To move a column in the data viewer, drag the column's heading to the left or right with the mouse. For example, the image below shows the mouse dragging the BER column to the left of its default position. When you release the mouse button, the columns snap into place.
