splitapply
Split data into groups and apply function
Syntax
Description
Y = splitapply(
splits func,X,G)X into groups specified by G and
applies the function func to each group.
splitapply returns Y as an array that
contains the concatenated outputs from func for the groups split
out of X. The input argument G is a vector of
positive integers that specifies the groups to which corresponding elements of
X belong. If G contains
NaN values, splitapply omits the
corresponding values in X when it splits X
into groups. To create G, you can use the findgroups function.
splitapply combines two steps in the Split-Apply-Combine Workflow.
[Y1,...,YM] = splitapply(___) splits
variables into groups and applies func to each
group. func returns multiple output arguments. Y1,...,YM contains
the concatenated outputs from func for the groups
split out of the input data variables. func can
return output arguments that belong to different classes, but the
class of each output must be the same each time func is
called. You can use this syntax with any of the input arguments of
the previous syntaxes.
The number of output arguments from func need
not be the same as the number of input arguments specified by X1,...,XN.
Examples
Input Arguments
More About
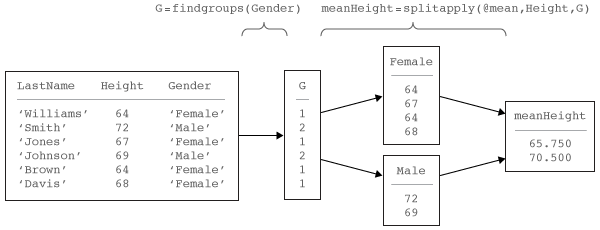
Split-Apply-Combine Workflow
The Split-Apply-Combine workflow
is common in data analysis. In this workflow, the analyst splits the
data into groups, applies a function to each group, and combines the
results. The diagram shows a typical example of the workflow and the
parts of the workflow implemented by findgroups and splitapply.
Extended Capabilities
See Also
accumarray | arrayfun | convertvars | discretize | findgroups | groupsummary | histcounts | rowfun | unique | varfun | vartype