1-D Wavelet Packet Analysis
We now turn to the Wavelet Packet 1-D tool to analyze a synthetic signal that is the sum of two linear chirps.
Starting the Wavelet Packet 1-D Tool
Importing a Signal
At the MATLAB command prompt, type
load sumlichr;
In the Wavelet Packets 1-D tool, select File > Import from Workspace > Import Signal. When the Import from Workspace dialog box appears, select the
sumlichrvariable. Click OK to import the data.The
sumlichrsignal is loaded into the Wavelet Packet 1-D tool.
Analyzing a Signal
Make the appropriate settings for the analysis. Select the
db2wavelet, level4, entropythreshold, and for the threshold parameter type1. Click the Analyze button.
The available entropy types are listed below.
Type | Description |
|---|---|
Shannon | Nonnormalized entropy involving the logarithm of the squared value of each signal sample — or, more formally, |
Threshold | The number of samples for which the absolute value of the signal exceeds a threshold ε. |
Norm | The concentration in lp norm with 1 ≤ p. |
Log Energy | The logarithm of “energy,” defined as the sum over all samples: |
SURE (Stein's Unbiased Risk Estimate) | A threshold-based method in which the threshold equals where n is the number of samples in the signal. |
User | An entropy type criterion you define in a file. |
For more information about the available entropy types, user-defined
entropy, and threshold parameters, see the wentropy reference
page and Choosing the Optimal Decomposition.
Note
Many capabilities are available using the command area on the right of the Wavelet Packet 1-D window.
Computing the Best Tree
Because there are so many ways to reconstruct the original signal from the wavelet packet decomposition tree, we select the best tree before attempting to compress the signal.
Click the Best Tree button.

After a pause for computation, the Wavelet Packet 1-D tool displays the best tree. Use the top and bottom sliders to spread nodes apart and pan over to particular areas of the tree, respectively.
Observe that, for this analysis, the best tree and the initial tree are almost the same. One branch at the far right of the tree was eliminated.

Compressing a Signal Using Wavelet Packets
Selecting a Threshold for Compression
Click the Compress button.
The Wavelet Packet 1-D Compression window appears with an approximate threshold value automatically selected.

The leftmost graph shows how the threshold (vertical black dotted line) has been chosen automatically (1.482) to balance the number of zeros in the compressed signal (blue curve that increases as the threshold increases) with the amount of energy retained in the compressed signal (purple curve that decreases as the threshold increases).
This threshold means that any signal element whose value is less than 1.482 will be set to zero when we perform the compression.
Threshold controls are located to the right (see the red box in the figure above). Note that the automatic threshold of 1.482 results in a retained energy of only 81.49%. This may cause unacceptable amounts of distortion, especially in the peak values of the oscillating signal. Depending on your design criteria, you may want to choose a threshold that retains more of the original signal's energy.
Adjust the threshold by typing
0.8938in the text field opposite the threshold slider, and then press the Enter key.
The value
0.8938is a number that we have discovered through trial and error yields more satisfactory results for this analysis.After a pause, the Wavelet Packet 1-D Compression window displays new information.
Note that, as we have reduced the threshold from 1.482 to 0.8938,
The vertical black dotted line has shifted to the left.
The retained energy has increased from 81.49% to 90.96%.
The number of zeros (equivalent to the amount of compression) has decreased from 81.55% to 75.28%.
Compressing a Signal
Click the Compress button.
The Wavelet Packet 1-D tool compresses the signal using the thresholding criterion we selected.

The original (red) and compressed () signals are displayed superimposed. Visual inspection suggests the compression quality is quite good.
Looking more closely at the compressed signal, we can see that the number of zeros in the wavelet packets representation of the compressed signal is about 75.3%, and the retained energy about 91%.
If you try to compress the same signal using wavelets with exactly the same parameters, only 89% of the signal energy is retained, and only 59% of the wavelet coefficients set to zero. This illustrates the superiority of wavelet packets for performing compression, at least on certain signals.
You can demonstrate this to yourself by returning to the main Wavelet Packet 1-D window, computing the wavelet tree, and then repeating the compression.
De-Noising a Signal Using Wavelet Packets
We now use the Wavelet Packet 1-D tool to analyze a noisy chirp signal. This analysis illustrates the use of Stein's Unbiased Estimate of Risk (SURE) as a principle for selecting a threshold to be used for de-noising.
This technique calls for setting the threshold T to
where n is the length of the signal.
A more thorough discussion of the SURE criterion appears in Choosing the Optimal Decomposition. For now, suffice it to say that this method works well if your signal is normalized in such a way that the data fit the model x(t) = f(t) + e(t), where e(t) is a Gaussian white noise with zero mean and unit variance.
If you've already started the Wavelet Packet 1-D tool and it is active on your computer's desktop, skip ahead to step 3.
Starting the Wavelet Packet 1–D Tool
From the MATLAB prompt, type
waveletAnalyzer.The Wavelet Analyzer appears.

Click the Wavelet Packet 1-D menu item.
The tool appears on the desktop.

Importing a Signal
At the MATLAB command prompt, type
load noischir;
In the Wavelet Packet 1-D tool, select File > Import from Workspace > Import Signal. When the Import from Workspace dialog box appears, select the
sumlichrvariable. Click OK to import the dataNote
You can use File > Load > Signal to load a signal by navigating to its location.
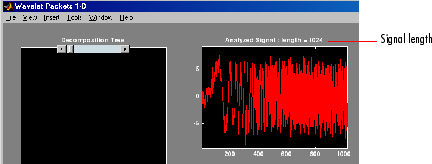
The signal's length is 1024. This means we should set the SURE criterion threshold equal to
sqrt(2.*log(1024.*log2(1024))), or 4.2975.
Analyzing a Signal
Make the appropriate settings for the analysis. Select the
db2wavelet, level4, entropy typesure, and threshold parameter 4.2975. Click the Analyze button.
There is a pause while the wavelet packet analysis is computed.
Note
Many capabilities are available using the command area on the right of the Wavelet Packet 1-D window. Some of them are used in the sequel. For a more complete description, see Wavelet Packet Tool Features (1-D and 2-D).
Computing the Best Tree and Performing De-Noising
Computing the best tree makes the de-noising calculations more efficient.

Click the De-noise button. This brings up the Wavelet Packet 1-D De-Noising window.

Click the De-noise button located at the center right side of the Wavelet Packet 1-D De-Noising window.
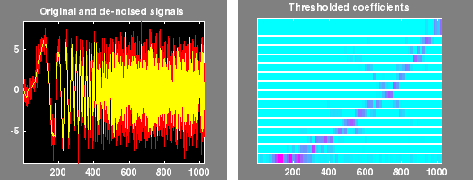
The results of the de-noising operation are quite good, as can be seen by looking at the thresholded coefficients. The frequency of the chirp signal increases quadratically over time, and the thresholded coefficients essentially capture the quadratic curve in the time-frequency plane.

You can also use the wpdencmp function to perform
wavelet packet de-noising or compression from the command line.