wpviewcf
Plot wavelet packets colored coefficients
Syntax
wpviewcf(T,CMODE)

wpviewcf(T,CMODE,NBCOL)
Description
wpviewcf( plots
the colored coefficients for the terminal nodes of the tree T,CMODE)T.
T is a wavelet packet tree and CMODE is
an integer, which represents the color mode. The color modes are listed
in the table below.
| Color Mode | Description |
|---|---|
| 1 | Frequency order – Global coloration – Absolute values |
| 2 | Frequency order – By level – Absolute values |
| 3 | Frequency order – Global coloration – Values |
| 4 | Frequency order – By level coloration – Values |
| 5 | Natural order – Global coloration – Absolute values |
| 6 | Natural order – By level – Absolute values |
| 7 | Natural order – Global coloration – Values |
| 8 | Natural order – By level coloration – Values |
wpviewcf( uses T,CMODE,NBCOL)NBCOL colors.
Examples
% Create a wavelet packet tree.
x = sin(8*pi*[0:0.005:1]);
t = wpdec(x,3,'db1');

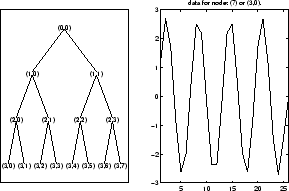
% Plot tree t.
% Click the node (3,0), (see the plot function)
plot(t);

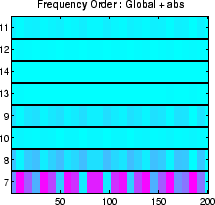
% Plot the colored wavelet packet coefficients.
wpviewcf(t,1);

See Also
Introduced before R2006a