Y-Parameters Passive Network

Model passive network using Y-parameters

  • Library:
  • RF Blockset / Equivalent Baseband / Black Box Elements

  • Y-Parameters Passive Network block

Description

The Y-Parameters Passive Network block models the two-port passive network described in the block dialog box, in terms of its Y-parameters and their associated frequencies.

In the Y-Parameters field of the block dialog box, provide the Y-parameters for each of the M frequencies as a 2-by-2-by-M array. In the Frequency field, specify the frequencies for the Y-parameters as an M-element vector. The elements of the vector must be in the same order as the Y-parameters. The figure shows the correspondence between the Y-parameters array and the vector of frequencies.
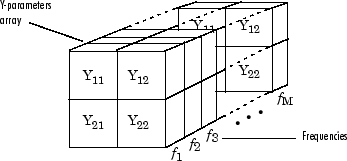
The Y-Parameters Passive Network block uses the RF Toolbox™ y2s function to convert the Y-parameters to S-parameters, and then interpolates the resulting S-parameters to determine their values at the modeling frequencies. The modeling frequencies are determined by the Output Port block. See Map Network Parameters to Modeling Frequencies for more details.

Parameters

expand all

Main

Y-parameters for a two-port passive network, specified as a 2-by-2-by-M array where M is the number of Y-parameters.

Frequency of Y-parameters, specified as an M-element vector with each element unit in hertz. All frequencies must be positive.

Method to interpolate the network parameters, specified as one of the following:

MethodDescription
LinearLinear interpolation
SplineCubic spline interpolation
CubicPiecewise cubic Hermite interpolation

Visualization

Frequency data source, specified as Same as the Y-Parameters or User-specified.

Frequency data range, specified as a vector with each element unit in hertz.

Type of data plot to visualize using the given data, specified as one of the following:

  • X-Y plane — Generate a Cartesian plot of the data versus frequency. To create linear, semilog, or log-log plots, set the Y-axis scale and X-axis scale accordingly.

  • Composite data — Plot the composite data.

  • Polar plane — Generate a polar plot of the data. The block plots only the range of data corresponding to the specified frequencies.

  • Z smith chart, Y smith chart, and ZY smith chart — Generate a Smith® chart. The block plots only the range of data corresponding to the specified frequencies.

Type of S-Parameters to plot, specified as one of the following. When noise is spectral, NF plotting is possible.

S11S12S21S22
GroupDelayGammaInGammaOutVSWRIn
VSWROutOIP3IIP3NF
NFactorNTempTF1TF2
TF3GtGaGp
GmagGmsgGammaMSGammaML
KDeltaMuMuPrime

Type of S-Parameters to plot, specified as one of the following. When noise is spectral, NF plotting is possible.

S11S12S21S22
GroupDelayGammaInGammaOutVSWRIn
VSWROutOIP3IIP3NF
NFactorNTempTF1TF2
TF3GtGaGp
GmagGmsgGammaMSGammaML
KDeltaMuMuPrime

Plot format, specified as one of the following.

dBMagnitude (decibels)AbsMag
Magnitude (linear)AngleAngle(degrees)Angle(radians)
RealImagImaginary 

Plot format, specified as one of the following.

dBMagnitude (decibels)AbsMag
Magnitude (linear)AngleAngle(degrees)Angle(radians)
RealImagImaginary 

Frequency plot, specified as Freq.

Frequency plot format, specified as one of the following.

AutoHzkHzMHz
GHzTHz  

Y-axis scale, specified as Linear or Log.

X-axis scale, specified as Linear or Log.

Plot specified data using the plot button.

Introduced before R2006a