power_zmeter
Compute impedance versus frequency of Impedance Measurement blocks of model
Syntax
power_zmeter('sys')

Zdata = power_zmeter('sys',freq)
Description
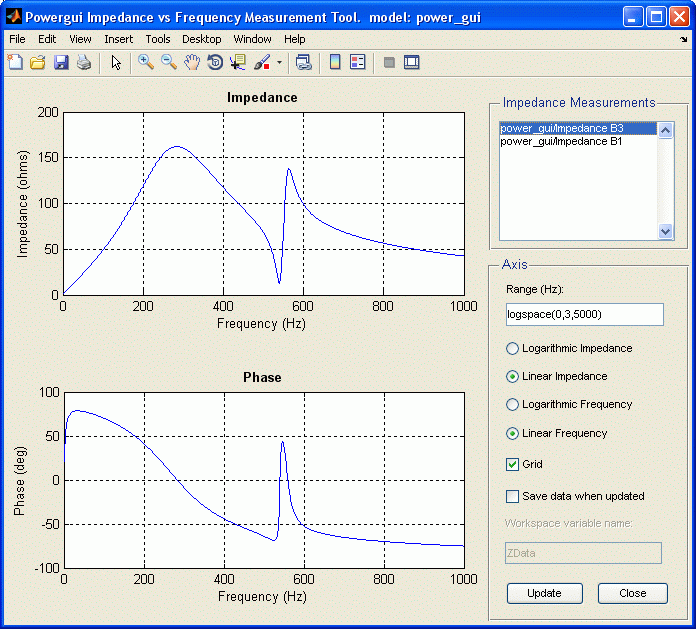
power_zmeter('sys') opens the Impedance
vs Frequency Measurement Tool dialog box to display the impedance
versus frequency defined by the Impedance Measurement blocks. This
tool can also be activated from the Powergui block dialog box by selecting Impedance vs Frequency Measurement.
Zdata = power_zmeter('sys',freq) returns
a structure that contains a list of Impedance Measurement blocks and
computed impedances versus frequency for the specified frequency range.
For example:
Zdata = power_zmeter('power_gui',logspace(0,3,500))
Zdata =

    Blocks: {[1x23 char]  'power_gui/Impedance B1'}
         Z: [500x2 double]
      Freq: [500x1 double]
Dialog Box

- Measurement
Lists the Impedance Measurement blocks of the model. Select the blocks for which you want to obtain the frequency response. Use the CTRL key to select several impedances to be displayed on the same plot.
- Range (Hz)
Specify the frequency vector, in hertz (Hz). You can specify in that field any valid MATLAB® expression defining a vector of frequencies; for example,
0:2:1000orlinspace(0,1000,500). The default islogspace(0,3,50).- Logarithmic Impedance/Linear Impedance
Choose logarithmic or linear scale for the vertical impedance scale.
- Logarithmic Frequency/Linear Frequency
Choose logarithmic or linear scale for the horizontal frequency scales.
- Grid
If selected, a grid is displayed for the two plots. Default is unselected.
- Save data when updated
If selected, data are saved in a variable in the workspace. The name of the variable is defined by the Workspace variable name parameter. The complex impedances are saved in an array together with the corresponding frequencies. Frequency is saved in column 1 and impedances are saved in the next columns. Default is unselected.
- Display/Save or Update
Click to initially display the impedance versus frequency measurement and, if the Save data when updated check box is selected, save the data to your workspace.
Click to start the impedance versus frequency measurement again and display results after multiple runs of your model.