treeplot
Plot picture of tree
Syntax
treeplot(p)

treeplot(p,nodeSpec,edgeSpec)
Description
treeplot(p) plots a picture
of a tree given a vector of parent pointers, with p(i) =
0 for a root.
treeplot(p,nodeSpec,edgeSpec) allows
optional parameters nodeSpec and edgeSpec to
set the node or edge color, marker, and linestyle. Use '' to
omit one or both.
Examples
To plot a tree with 12 nodes, call treeplot with
a 12-element input vector. The index of each element in the vector
is shown adjacent to each node in the figure below. (These indices
are shown only for the point of illustrating the example; they are
not part of the treeplot output.)
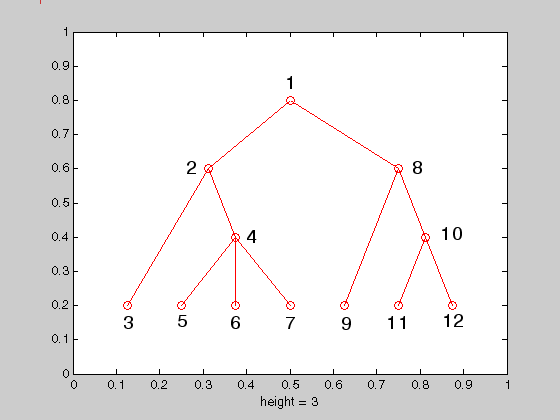
To generate this plot, set the value of each element in the nodes vector
to the index of its parent, (setting the parent of the root node to
zero).
The node marked 1 in the figure is represented
by nodes(1) in the input vector, and because this
is the root node which has a parent of zero, you set its value to
zero:
nodes(1) = 0; % Root node
nodes(2) and nodes(8) are
children of nodes(1), so set these elements of
the input vector to 1:
nodes(2) = 1; nodes(8) = 1;
nodes(5:7) are children of nodes(4),
so set these elements to 4:
nodes(5) = 4; nodes(6) = 4; nodes(7) = 4;
Continue in this manner until each element of the vector identifies
its parent. For the plot shown above, the nodes vector
now looks like this:
nodes = [0 1 2 2 4 4 4 1 8 8 10 10];
Now call treeplot to generate the plot:
treeplot(nodes)
See Also
etree | etreeplot | treelayout