Determine Code Coverage Using the Profiler
When you run the Profiler on a file, some code might not run,
such as a block containing an if statement.
To determine how much of a file MATLAB® executed when you profiled it, run the Coverage Report.
Profile your MATLAB code file. For more information, see Profile Your Code to Improve Performance or the
profilefunction.Ensure that the Profiler is not currently profiling.
In the Profiler, a Stop Profiling button displays if the Profiler is running. If the Profiler is running, click the Stop Profiling button.
At the command prompt, check the Profiler status using
profile
status
. If theProfilerStatusis'on', stop the Profiler by typingprofile off.
Use the Current Folder browser to navigate to the folder containing the profiled code file.
On the Current Folder browser, click
 , and then select Reports > Coverage Report.
The Profiler Coverage Report opens, providing a summary of coverage for the profiled file. In the following image, the profiled file is
lengthofline2.m.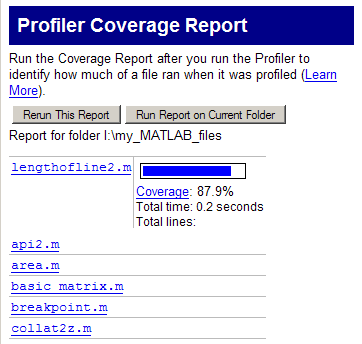
Click the Coverage link to see the Profile Detail Report for the file.