Sort and Plot MATLAB Data from Python
This example shows how to sort data about patients into lists of smokers and nonsmokers in Python® and plot blood pressure readings for the patients with MATLAB®.
Start the engine, and read data about a set of patients into
a MATLAB table. MATLAB provides a sample comma-delimited
file, patients.dat, which contains information
on 100 different patients.
import matlab.engine
eng = matlab.engine.start_matlab()
eng.eval("T = readtable('patients.dat');",nargout=0)
The MATLAB readtable function reads
the data into a table. The engine does not support the MATLAB table
data type. However, with the MATLAB table2struct function
you can convert the table to a scalar structure, which is a data type
the engine does support.
eng.eval("S = table2struct(T,'ToScalar',true);",nargout=0)
eng.eval("disp(S)",nargout=0)
                    LastName: {100x1 cell}
                      Gender: {100x1 cell}
                         Age: [100x1 double]
                    Location: {100x1 cell}
                      Height: [100x1 double]
                      Weight: [100x1 double]
                      Smoker: [100x1 double]
                    Systolic: [100x1 double]
                   Diastolic: [100x1 double]
    SelfAssessedHealthStatus: {100x1 cell}
You can pass S from the MATLAB workspace
into your Python session. The engine converts S to
a Python dictionary, D.
D = eng.workspace["S"]
S has fields that contain arrays. The engine
converts cell arrays to Python list variables,
and numeric arrays to MATLAB arrays. Therefore, D["LastName"] is
of data type list, and D["Age"] is
of data type matlab.double.
Sort blood pressure readings into lists of smokers and nonsmokers.
In patients.dat, the column Smoker indicated
a smoker with logical 1 (true), and a nonsmoker with a logical 0 (false).
Convert D["Smoker"] to a matlab.logical array
for sorting.
smoker = matlab.logical(D["Smoker"])
Convert the Diastolic blood pressure readings
and Smoker indicators into 1-by-100 MATLAB arrays
for sorting.
pressure = D["Diastolic"]
pressure.reshape((1,100))
pressure = pressure[0]
smoker.reshape((1,100))
smoker = smoker[0]
Sort the pressure array into lists of blood pressure readings for smokers
and non-smokers. Python list comprehensions provide a compact method for iterating over sequences.
With the Python
zip function, you can iterate over multiple sequences in a single
for
loop.
sp = [p for (p,s) in zip(pressure,smoker) if s is True]
nsp = [p for (p,s) in zip(pressure,smoker) if s is False]
Display the length of sp, the blood pressure
readings for smokers in a list.
print(len(sp))
34
Display the length of nsp, the list of
readings for nonsmokers.
print(len(nsp))
66
Calculate the mean blood pressure readings for smokers and nonsmokers.
Convert sp and nsp to MATLAB arrays
before passing them to the MATLAB mean function.
sp = matlab.double(sp)
nsp = matlab.double(nsp)
print(eng.mean(sp))
89.9117647059
Display the mean blood pressure for the nonsmokers.
print(eng.mean(nsp))
79.3787878788
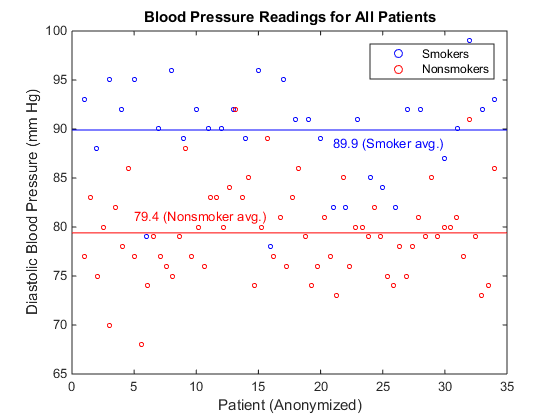
Plot blood pressure readings for the smokers and nonsmokers. To define two
x-axes for plotting, call the MATLAB
linspace function. You can plot the 34 smokers and 66 nonsmokers on
the same scatter
plot.
sdx = eng.linspace(1.0,34.0,34)
nsdx = eng.linspace(1.0,34.0,66)
Show the axes boundaries with the box function.
eng.figure(nargout=0)
eng.hold("on",nargout=0)
eng.box("on",nargout=0)
You must call the figure, hold,
and box functions with nargout=0,
because these functions do not return output arguments.
Plot the blood pressure readings for the smokers and nonsmokers, and label the plot. For many MATLAB functions, the engine can return a handle to a MATLAB graphics object. You can store a handle to a MATLAB object in a Python variable, but you cannot manipulate the object properties in Python. You can pass MATLAB objects as input arguments to other MATLAB functions.
eng.scatter(sdx,sp,10,'blue')
<matlab.object object at 0x22d1510>
In the rest of this example, assign the output argument of MATLAB functions
to h as a placeholder.
h = eng.scatter(nsdx,nsp,10,'red')
h = eng.xlabel("Patient (Anonymized)")
h = eng.ylabel("Diastolic Blood Pressure (mm Hg)")
h = eng.title("Blood Pressure Readings for All Patients")
h = eng.legend("Smokers","Nonsmokers")
Draw lines showing the average blood pressure readings for smokers and nonsmokers.
x = matlab.double([0,35])
y = matlab.double([89.9,89.9])
h = eng.line(x,y,"Color","blue")
h = eng.text(21.0,88.5,"89.9 (Smoker avg.)","Color","blue")
y = matlab.double([79.4,79.4])
h = eng.line(x,y,"Color","red")
h = eng.text(5.0,81.0,"79.4 (Nonsmoker avg.)","Color","red")