Image Types
Indexed Images
An indexed image consists of a data matrix, X, and a colormap
matrix, map. map is an
m-by-3 array of class double containing
floating-point values in the range [0, 1]. Each row of map
specifies the red, green, and blue components of a single color. An indexed image
uses “direct mapping” of pixel values to colormap values. The color of
each image pixel is determined by using the corresponding value of
X as an index into map. Values of
X therefore must be integers. The value 1 points to the first
row in map, the value 2 points to the second row, and so on.
Display an indexed image with the statements
image(X); colormap(map)
A colormap is often stored with an indexed image and is automatically loaded with
the image when you use the imread function. However, you are not
limited to using the default colormap—use any colormap that you choose. The
description for the property CDataMapping
describes how to alter the type of mapping used.
The next figure illustrates the structure of an indexed image. The pixels in the image are represented by integers, which are pointers (indices) to color values stored in the colormap.

The relationship between the values in the image matrix and the colormap depends
on the class of the image matrix. If the image matrix is of class
double, the value 1 points to the first row in the colormap,
the value 2 points to the second row, and so on. If the image matrix is of class
uint8 or uint16, there is an
offset—the value 0 points to the first row in the colormap, the value 1
points to the second row, and so on. The offset is also used in graphics file
formats to maximize the number of colors that can be supported. In the preceding
image, the image matrix is of class double. Because there is no
offset, the value 5 points to the fifth row of the colormap.
Note
When using the painters renderer on the Windows® platform, you should only use 256 colors when attempting to
display an indexed image. Larger colormaps can lead to unexpected colors because
the painters algorithm uses the Windows 256 color palette, which graphics drivers and graphics hardware
are known to handle differently. To work around this issue, use the
Zbuffer or OpenGL renderer, as
appropriate.
Grayscale (Intensity) Images
A grayscale image, sometimes referred to as an intensity
image, is a data matrix I whose values represent intensities
within some range. A grayscale image is represented as a single matrix, with each
element of the matrix corresponding to one image pixel. The matrix can be of class
double, uint8, or
uint16. While grayscale images are rarely saved with a
colormap, a colormap is still used to display them. In essence, grayscale images are
treated as indexed images.
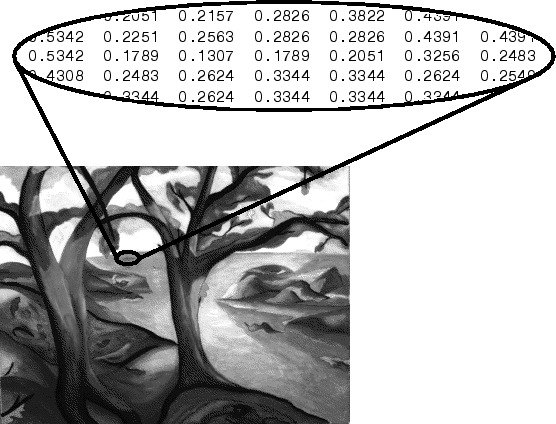
This figure depicts a grayscale image of class double.

To display a grayscale image, use the imagesc (“image scale”) function, which enables you to
set the range of intensity values. imagesc scales the image data
to use the full colormap. Use the two-input form of imagesc to
display a grayscale image, for example:
imagesc(I,[0 1]); colormap(gray);
The second input argument to imagesc specifies the desired
intensity range. The imagesc function displays
I by mapping the first value in the range (usually 0) to the
first colormap entry, and the second value (usually 1) to the last colormap entry.
Values in between are linearly distributed throughout the remaining colormap colors.
Although it is conventional to display grayscale images using a grayscale
colormap, it is possible to use other colormaps. For example, the following
statements display the grayscale image I in shades of blue and
green:
imagesc(I,[0 1]); colormap(winter);
To display a matrix A with an arbitrary range of values as a
grayscale image, use the single-argument form of imagesc. With
one input argument, imagesc maps the minimum value of the data
matrix to the first colormap entry, and maps the maximum value to the last colormap
entry. For example, these two lines are equivalent:
imagesc(A); colormap(gray)
imagesc(A,[min(A(:)) max(A(:))]); colormap(gray)
RGB (Truecolor) Images
An RGB image, sometimes referred to as a truecolor image, is stored as an m-by-n-by-3 data array that defines red, green, and blue color components for each individual pixel. RGB images do not use a palette. The color of each pixel is determined by the combination of the red, green, and blue intensities stored in each color plane at the pixel's location. Graphics file formats store RGB images as 24-bit images, where the red, green, and blue components are 8 bits each. This yields a potential of 16 million colors. The precision with which a real-life image can be replicated has led to the nickname “truecolor image.”
An RGB MATLAB® array can be of class double,
uint8, or uint16. In an RGB array of class
double, each color component is a value between 0 and 1. A
pixel whose color components are (0,0,0) is displayed as black, and a pixel whose
color components are (1,1,1) is displayed as white. The three color components for
each pixel are stored along the third dimension of the data array. For example, the
red, green, and blue color components of the pixel (10,5) are stored in
RGB(10,5,1), RGB(10,5,2), and
RGB(10,5,3), respectively.
To display the truecolor image RGB, use the image function:
image(RGB)
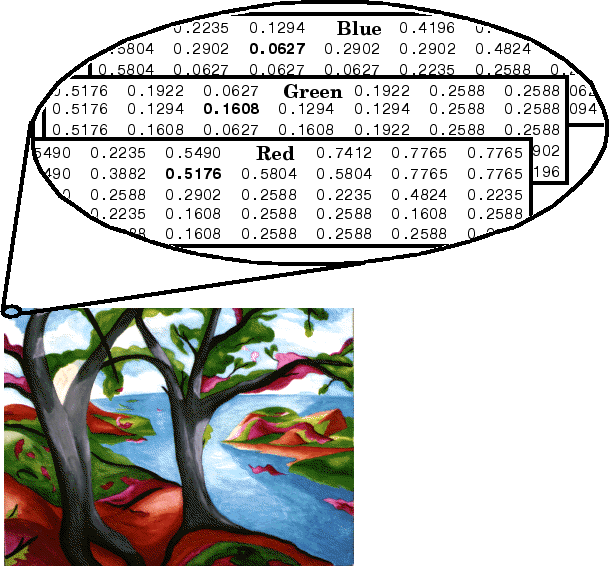
The next figure shows an RGB image of class double.

To determine the color of the pixel at (2,3), look at the RGB triplet stored in
(2,3,1:3). Suppose (2,3,1) contains the value 0.5176, (2,3,2)
contains 0.1608, and (2,3,3) contains 0.0627.
The color for the pixel at (2,3) is
0.5176 0.1608 0.0627