Visualize Differences Between Floating-Point and Fixed-Point Results
This example shows how to configure the MATLAB® Coder™ app to use a custom plot function to compare the behavior of the generated fixed-point code against the behavior of the original floating-point MATLAB code.
By default, when the Log inputs and outputs for comparison plots option is enabled, the conversion process uses a time series based plotting function to show the floating-point and fixed-point results and the difference between them. However, during fixed-point conversion you might want to visualize the numerical differences in a view that is more suitable for your application domain. This example shows how to customize plotting and produce scatter plots at the test numerics step of the fixed-point conversion.
Prerequisites
This example requires the following products:
MATLAB
Fixed-Point Designer™
MATLAB Coder
C compiler
See Supported Compilers.
You can use
mex -setupto change the default compiler. See Change Default Compiler.
Create a New Folder and Copy Relevant Files
Create a local working folder, for example,
c:\custom_plot.Change to the
docroot\toolbox\fixpoint\examplesfolder. At the MATLAB command line, enter:cd(fullfile(docroot, 'toolbox', 'fixpoint', 'examples'))
Copy the
myFilter.m,myFilterTest.m,plotDiff.m, andfilterData.matfiles to your local working folder.Type Name Description Function code myFilter.mEntry-point MATLAB function Test file myFilterTest.mMATLAB script that tests myFilter.mPlotting function plotDiff.mCustom plot function MAT-file filterData.matData to filter.
Open the MATLAB Coder App
Navigate to the folder that contains the files for this example.
On the MATLAB Toolstrip Apps tab, under Code Generation, click the app icon.
Select Source Files
To add the entry-point function myFilter to
the project, browse to the file myFilter.m, and
then click Open.
By default, the app saves information and settings for this
project in the current folder in a file named myFilter.prj.
Enable Fixed-Point Conversion
Set Numeric Conversion to
Convert
to fixed point
.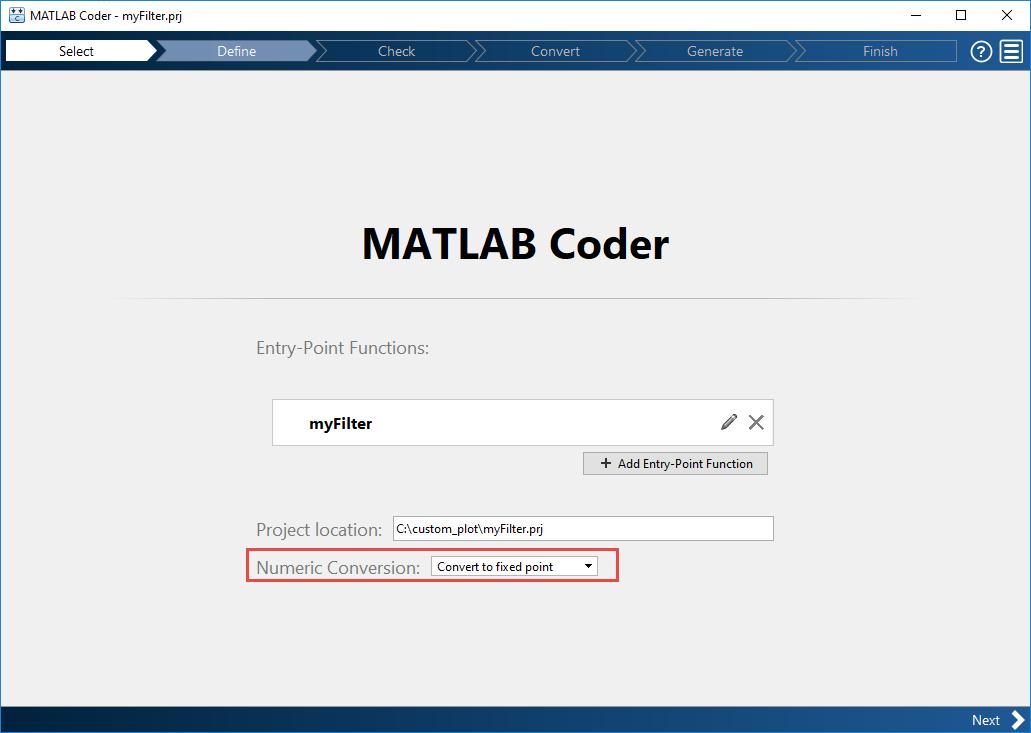
Click Next to go to the Define Input Types step.
The app screens
myFilter.mfor code violations and code generation readiness issues. The app does not find issues inmyFilter.m.
Define Input Types
On the Define Input Types page, to add
myFilterTestas a test file, browse tomyFilterTest.m, and then click Open.Click Autodefine Input Types.
The app determines from the test file that the input type of
iniscomplex(double(1x1)).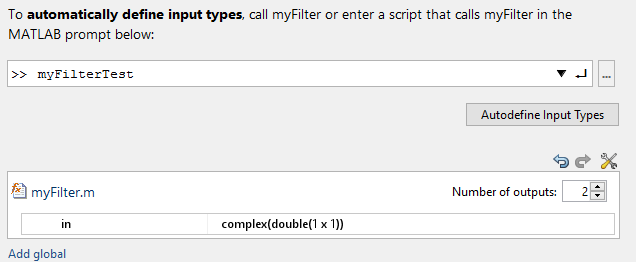
Click Next to go to the Check for Run-Time Issues step.
Check for Run-Time Issues
The Check for Run-Time Issues step generates
instrumented MEX. myFilter. It runs the test
file myFilterTest replacing calls to myFilter with
calls to the generated MEX. If the app finds issues, it provides warning
and error messages. You can click a message to highlight the problematic
code in a window where you can edit the code.
Browse to the test file
myFiltertest.m.Click Check for Issues.
The app does not detect issues.
Click Next to go to the Convert to Fixed Point step.
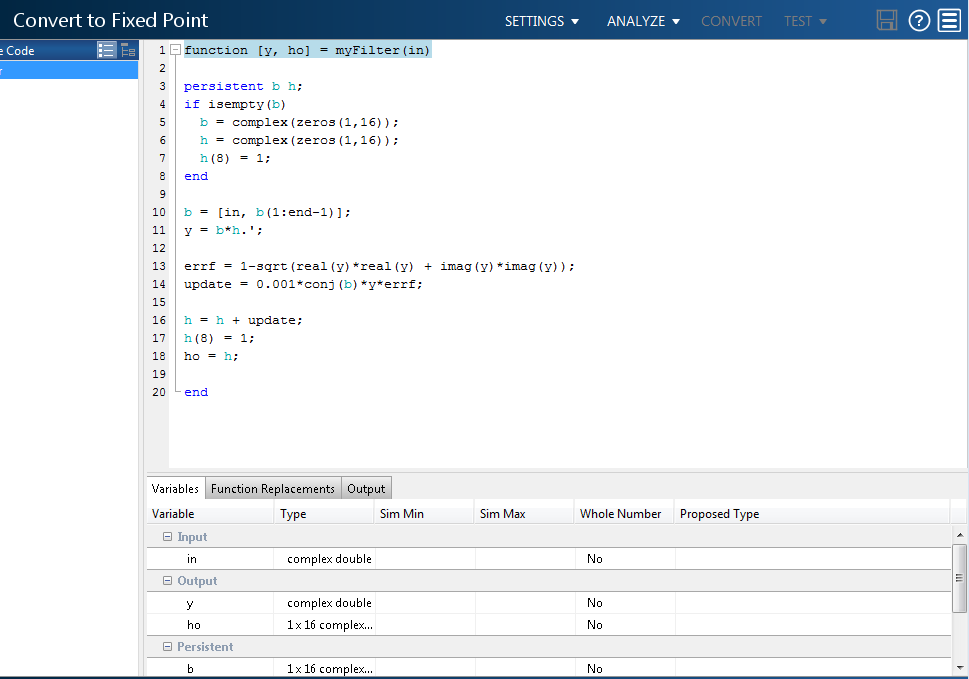
Convert to Fixed Point
The app displays compiled information for variables in your code. For more information, see View and Modify Variable InformationView and Modify Variable Information (Fixed-Point Designer).
To open the settings dialog box, click the Settings arrow
 .
. Verify that Default word length is set to
16.Under Advanced, set Signedness to
SignedUnder Plotting and Reporting, set Custom plot function to
plotDiff.
Click the Analyze arrow
. Verify that the test file is
myFilterTest.Click Analyze.
The test file,
myFilterTest, runs and the app displays simulation minimum and maximum ranges on the Variables tab. Using the simulation range data, the software proposes fixed-point types for each variable based on the default type proposal settings, and displays them in the Proposed Type column.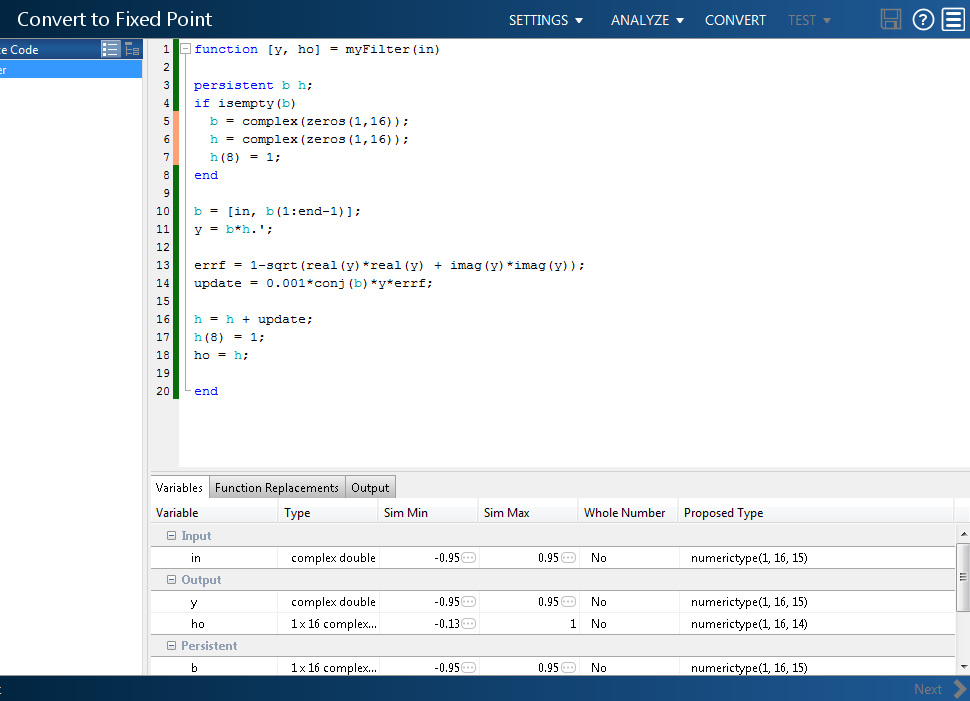
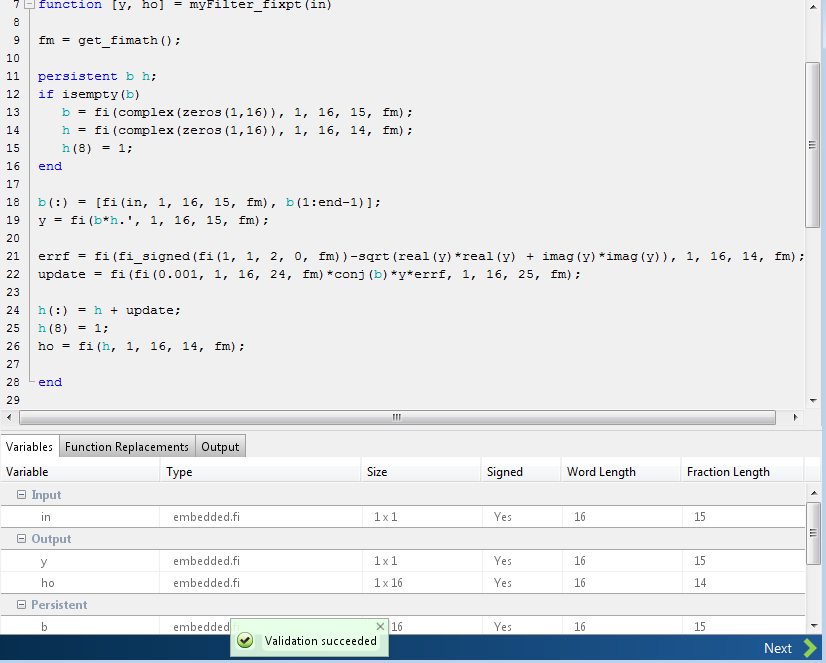
To convert the floating-point algorithm to fixed point, click Convert.
The software validates the proposed types and generates a fixed-point version of the entry-point function.
Test Numerics and View Comparison Plots
Click Test arrow
, select Log inputs and outputs
for comparison plots, and then click
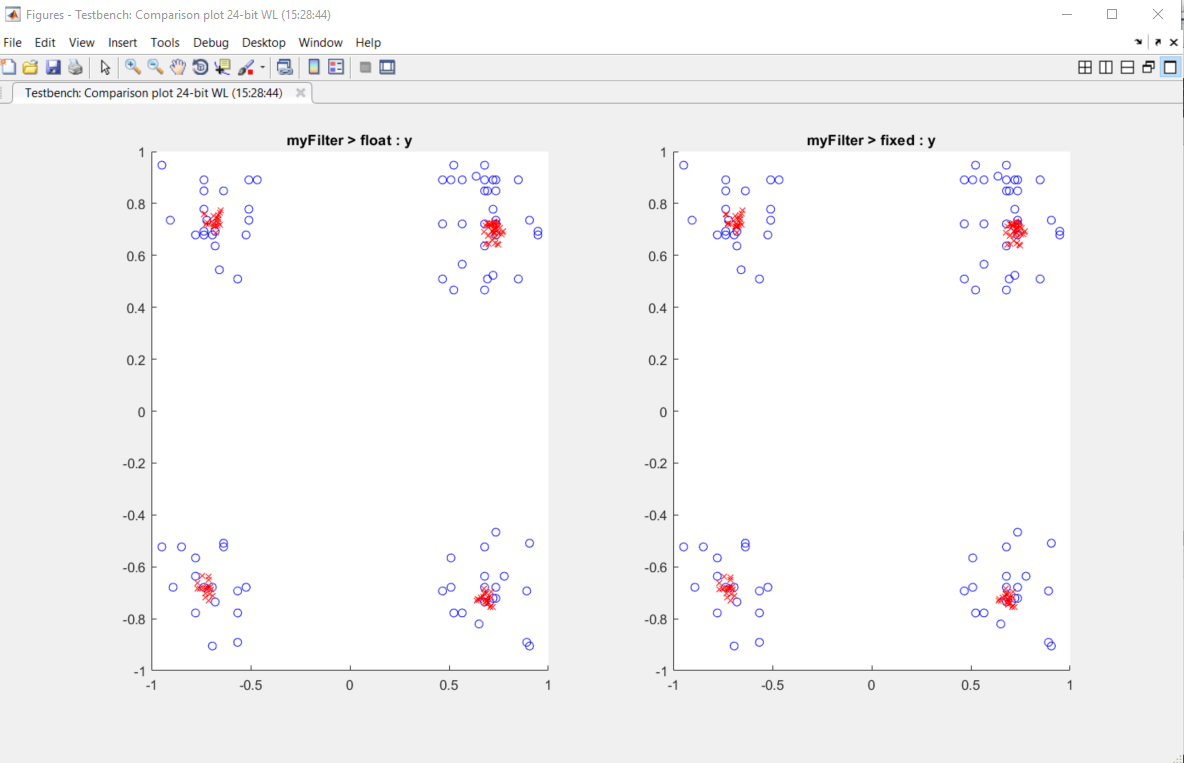
Test.The app runs the test file that you used to define input types to test the fixed-point MATLAB code. Because you selected to log inputs and outputs for comparison plots and to use the custom plotting function,
plotDiff.m, for these plots, the app uses this function to generate the comparison plot. The plot shows that the fixed-point results do not closely match the floating-point results.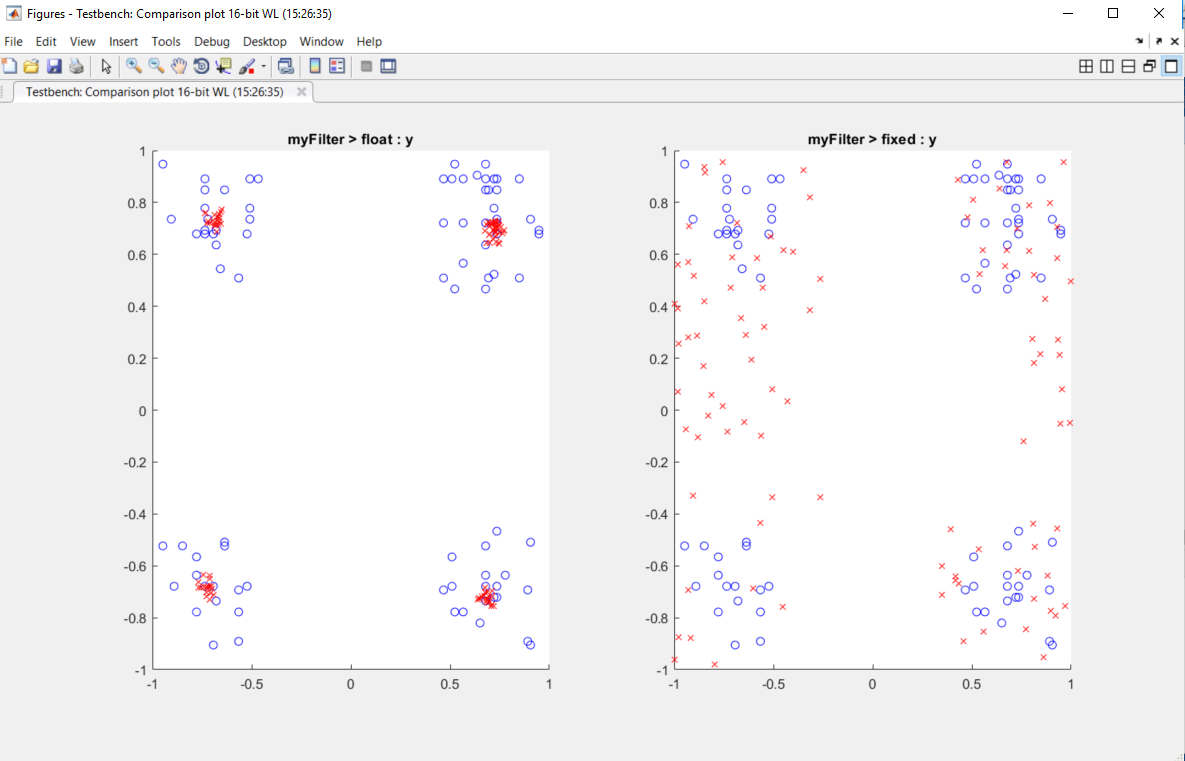
In the settings, increase the DefaultWordLength to
24and then convert to fixed point again.The app converts
myFilter.mto fixed point and proposes fixed-point data types using the new default word length.Run the test numerics step again.
The increased word length improves the results. This time, the plot shows that the fixed-point results match the floating-point results.