Propose Fixed-Point Data Types Based on Derived Ranges
This example shows how to propose fixed-point data types based on static ranges using the MATLAB® Coder™ app. When you propose data types based on derived ranges you, do not have to provide test files that exercise your algorithm over its full operating range. Running such test files often takes a long time. You can save time by deriving ranges instead.
Note
Derived range analysis is not supported for non-scalar variables.
Prerequisites
This example requires the following products:
MATLAB
MATLAB Coder
Fixed-Point Designer™
C compiler
See Supported Compilers.
You can use
mex -setupto change the default compiler. See Change Default Compiler.
Create a New Folder and Copy Relevant Files
Create a local working folder, for example,
c:\dti.Change to the
docroot\toolbox\fixpoint\examplesfolder. At the MATLAB command line, enter:cd(fullfile(docroot, 'toolbox', 'fixpoint', 'examples'))
Copy the
dti.manddti_test.mfiles to your local working folder.Type Name Description Function code dti.mEntry-point MATLAB function Test file dti_test.mMATLAB script that tests dti.m
Open the MATLAB Coder App
Navigate to the work folder that contains the file for this example.
On the MATLAB Toolstrip Apps tab, under Code Generation, click the app icon.
Select Source Files
To add the entry-point function dti to
the project, browse to the file dti.m, and then
click Open. By default, the app saves information
and settings for this project in the current folder in a file named dti.prj.
Enable Fixed-Point Conversion
Set Numeric Conversion to
Convert
to fixed point
.
Click Next to go to the Define Input Types step.
The app screens
dti.mfor code violations and code generation readiness issues. The app does not find issues indti.m.
Define Input Types
On the Define Input Types page, to add
dti_testas a test file, browse todti_test.m, and then click Open.Click Autodefine Input Types.
The test file runs. The app determines from the test file that the input type of
u_inisdouble(1x1).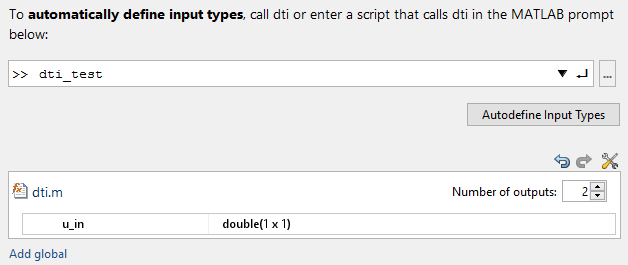
Click Next to go to the Check for Run-Time Issues step.
Check for Run-Time Issues
The Check for Run-Time Issues step generates
instrumented MEX. It runs the test file dti_test replacing
calls to dti with calls to the generated MEX
function. If the app finds issues, it provides warning and error messages.
You can click a message to highlight the problematic code in a window
where you can edit the code.
On the Check for Run-Time Issues page, the app populates the test file field with
dti_test, the test file that you used to define the input types.Click Check for Issues.
The app does not detect issues.
Click Next to go to the Convert to Fixed Point step.
Convert to Fixed Point
The app displays compiled information—type, size, and complexity—for variables in your code. For more information, see View and Modify Variable Information.

If functions are not supported for fixed-point conversion, the app displays them on the Function Replacements tab.
Click the Analyze arrow
 .
.Select Analyze ranges using derived range analysis.
Clear the Analyze ranges using simulation check box.
Design ranges are required to use derived range analysis.

On the Convert to Fixed Point page, on the Variables tab, for input
u_in, select Static Min and set it to-1. Set Static Max to1.To compute derived range information, at a minimum you must specify static minimum and maximum values or proposed data types for all input variables.
Note
If you manually enter static ranges, these manually entered ranges take precedence over simulation ranges. The app uses the manually entered ranges to propose data types. You can also modify and lock the proposed type.
Click Analyze.
Range analysis computes the derived ranges and displays them in the Variables tab. Using these derived ranges, the analysis proposes fixed-point types for each variable based on the default type proposal settings. The app displays them in the Proposed Type column.
In the
dtifunction, theclip_statusoutput has a minimum value of-2and a maximum of2.% Compute Output if (u_state > limit_upper) y = limit_upper; clip_status = -2; elseif (u_state >= limit_upper) y = limit_upper; clip_status = -1; elseif (u_state < limit_lower) y = limit_lower; clip_status = 2; elseif (u_state <= limit_lower) y = limit_lower; clip_status = 1; else y = u_state; clip_status = 0; end
When you derive ranges, the app analyzes the function and computes these minimum and maximum values for
clip_status.
The app provides a Quick derived range analysis option and the option to specify a timeout in case the analysis takes a long time. See Computing Derived Ranges.
To convert the floating-point algorithm to fixed point, click Convert.
During the fixed-point conversion process, the software validates the proposed types and generates the following files in the
codegen\dti\fixptfolder in your local working folder:dti_fixpt.m— the fixed-point version ofdti.m.dti_wrapper_fixpt.m— this file converts the floating-point data values supplied by the test file to the fixed-point types determined for the inputs during conversion. The app feeds these fixed-point values into the converted fixed-point design,dti_fixpt.m.dti_fixpt_report.html— this report shows the generated fixed-point code and the fixed-point instrumentation results.dti_report.html— this report shows the original algorithm and the fixed-point instrumentation results.dti_fixpt_args.mat— MAT-file containing a structure for the input arguments, a structure for the output arguments and the name of the fixed-point file.
If errors or warnings occur during validation, they show on the Output tab. See Validating Types.
In the Output Files list, select
dti_fixpt.m. The app displays the generated fixed-point code.Use the Simulation Data Inspector to plot the floating-point and fixed-point results.
Click the Settings arrow
.Expand the Plotting and Reporting settings and set Plot with Simulation Data Inspector to
Yes.
Click the Test arrow
. Select Log inputs and
outputs for comparison plots. Click Test.
The app runs the test file that you used to define input types to test the fixed-point MATLAB code. Optionally, you can add test files and select to run more than one test file to test numerics. The software runs both a floating-point and a fixed-point simulation and then calculates the errors for the output variable
y. Because you selected to log inputs and outputs for comparison plots and to use the Simulation Data Inspector for these plots, the Simulation Data Inspector opens.
You can use the Simulation Data Inspector to view floating-point and fixed-point run information and compare results. For example, to compare the floating-point and fixed-point values for the output
y, selecty. Click Compare. Set Baseline to the original run and Compare to to the converter run. Click Compare.The Simulation Data Inspector displays a plot of the baseline floating-point run against the fixed-point run and the difference between them.

On the Verification Output tab, the app provides a link to the Fixed_Point Report.
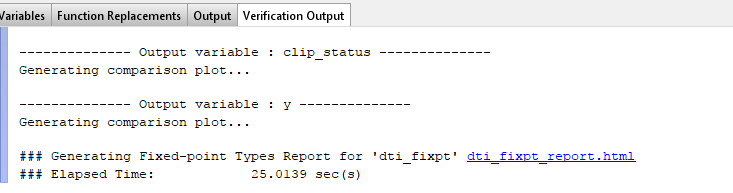
To open the report, click the dti_fixpt_report.html link.
Click Next to go to the Generate Code step.
Generate Fixed-Point C Code
In the Generate dialog box, set Build source to
Fixed-Pointand Build type toSource Code.Set Language to C.
Click Generate to generate a library using the default project settings.
MATLAB Coder builds the project and generates a C static library and supporting files in the default subfolder,
codegen/lib/dti_fixpt.The app displays the generated code for
dti_fixpt.c. In the generated C code, variables are assigned fixed-point data types.Click Next to go to the Finish Workflow page.
On the Finish Workflow page, the app displays a project summary and links to generated output files.