redgreencmap
Create red and green colormap
Syntax
redgreencmap(Length)


redgreencmap(Length,
'Interpolation', InterpolationValue)
Arguments
Length | Length of the colormap. Enter either |
InterpolationValue | Property that lets you set the algorithm for color interpolation.
Choices are:
Note The sigmoid interpolation is tanh. |
Description
redgreencmap( returns
a Length)Length-by-3 matrix
containing a red and green colormap. Low values are bright green,
values in the center of the map are black, and high values are red.
Enter either 256 or 64 for Length.
If Length is empty, the length of the map
will be the same as the length of the colormap of the current figure.
redgreencmap( lets
you set the algorithm for color interpolation. Choices are:Length,
'Interpolation', InterpolationValue)
'linear''quadratic''cubic''sigmoid'(default)
Note
The sigmoid interpolation is tanh.
Examples
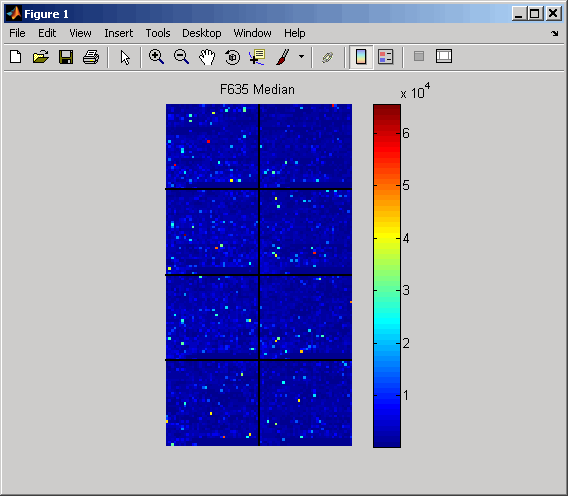
Create a MATLAB® structure from the microarray data in a GenePix® Results (GPR) file, then display an image of the
'F635 Median'field.pd = gprread('mouse_a1pd.gpr'); maimage(pd,'F635 Median')

Reset the colormap of the current figure.
colormap(redgreencmap)
