Plot Sine Wave
Calculate and plot a sine wave.
Contents
Calculate and Plot Sine Wave
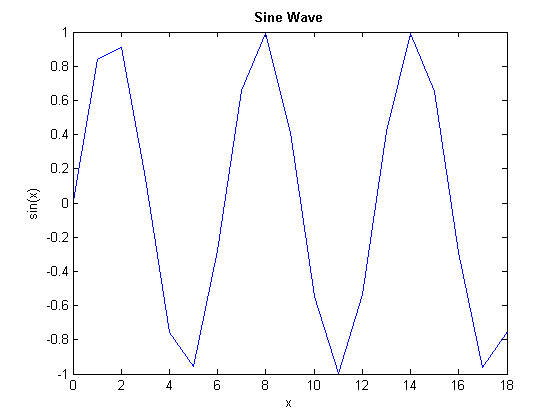
Calculate and plot y = sin(x).
function sine_wave_f(x)
y = sin(x);
plot(x,y)

Modify Plot Properties
title('Sine Wave', 'FontWeight','bold')
xlabel('x')
ylabel('sin(x)')
set(gca, 'Color', 'w')
set(gcf, 'MenuBar', 'none')