Debug Code in the Live Editor
To diagnose problems in your live scripts or functions, debug your code in the Live Editor. There are several ways to debug in the Live Editor:
Show output by removing semicolons.
Run to a specific line of code and pause using the
 Run to Here button.
Step into functions and scripts while paused by using the
 Step In button.
Add breakpoints to your file to enable pausing at specific lines when you run.
Show Output
A simple way to determine where a problem occurs in your live script or function is to show output. To show the output for a line, remove the semi-colon from the end of that line. The Live Editor displays each output with the line of code that creates it, making it easy to determine where a problem occurs.
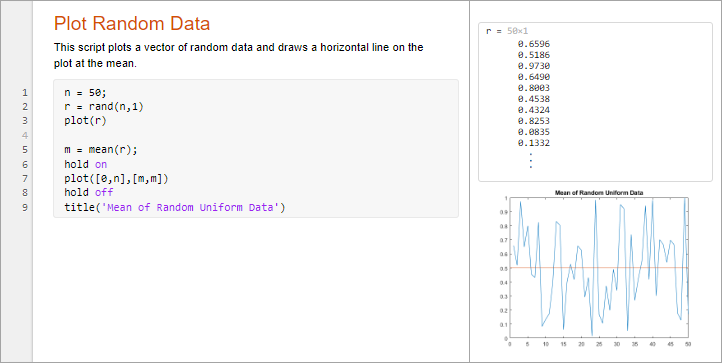
For example, suppose that you have a script called plotRand.mlx
that plots a vector of random data and draws a horizontal line on the plot at the
mean.
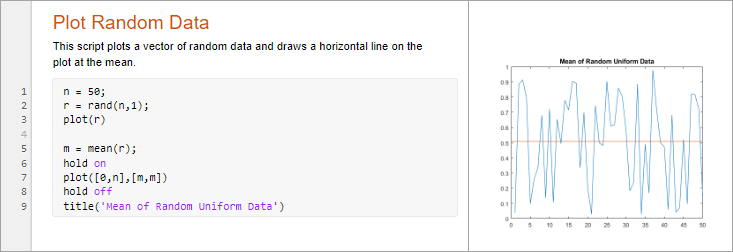
To display the output of the rand function at line 2, remove
the semi-colon at the end of the line. To display line numbers in the Live Editor if
they are not visible, go to the View tab and press the
![]() Line Numbers button. MATLAB® displays the value of
Line Numbers button. MATLAB® displays the value of r.
Debug Using Run to Here
Showing output is useful if you want to display the state of a single variable. To explore the state of all variables in the workspace, run your live script and then pause before running the specified line of code.
To run to a specified line of code and then pause, click the run to here
![]() button to the left of the line. If the selected
line cannot be reached, MATLAB continues running until the end of the file is reached or a breakpoint
is encountered. The run to here button is only available in live functions when
debugging.
button to the left of the line. If the selected
line cannot be reached, MATLAB continues running until the end of the file is reached or a breakpoint
is encountered. The run to here button is only available in live functions when
debugging.
For example, click the ![]() button to the left of line 2 in
button to the left of line 2 in
plotRand.mlx. MATLAB runs plotRand.mlx starting at line 1 and pauses
before running line 2.

When MATLAB pauses, the ![]() Run button in the Live Editor tab
changes to a
Run button in the Live Editor tab
changes to a ![]() Continue button. The Live Editor indicates the line at which
MATLAB is paused by highlighting the line in green. The highlighted line does
not run until after MATLAB resumes running.
Continue button. The Live Editor indicates the line at which
MATLAB is paused by highlighting the line in green. The highlighted line does
not run until after MATLAB resumes running.

Tip
It is a good practice to avoid modifying a file while MATLAB is paused. Changes that are made while MATLAB is paused do not run until after MATLAB finished running the code and the code is rerun.
To continue running the code, click the ![]() Continue button. MATLAB continues running the file until it reaches the end of the file or a
breakpoint. You also can click the
Continue button. MATLAB continues running the file until it reaches the end of the file or a
breakpoint. You also can click the ![]() button to the left of the line of code you want
to continue running to.
button to the left of the line of code you want
to continue running to.
To continue running the code line-by-line, on the Live Editor
tab, click ![]() Step. MATLAB executes the current line at which it is paused and the pauses at the
next line.
Step. MATLAB executes the current line at which it is paused and the pauses at the
next line.

You also can run up to the line with the cursor by going to the Live
Editor tab, selecting ![]() Step and then selecting
Step and then selecting ![]() Run to Cursor.
Run to Cursor.
View Variable Value While Debugging
To view the value of a variable while MATLAB is paused, hover the mouse pointer over the variable. The current
value of the variable appears in a data tip. The data tip stays in view until you
move the pointer. To disable data tips, go to the View tab and
press the ![]() Datatips button.
Datatips button.

You also can view the value of a variable by typing the variable name in the
Command Window. For example, to see the value of the variable n,
type n and press Enter. The Command Window
displays the variable name and its value. To view all the variables in the current
workspace, use the Workspace browser.
Pause a Running File
To pause a program while it is running, go to the Live Editor
tab and click the ![]() Pause button. MATLAB pauses at the next executable line, and the
Pause button. MATLAB pauses at the next executable line, and the
![]() Pause button changes to a
Pause button changes to a ![]() Continue button. To continue running, press the
Continue button. To continue running, press the
![]() Continue button.
Continue button.
Pausing is useful if you want to check on the progress of a long running program to ensure that it is running as expected.
Note
Clicking the pause button can cause MATLAB to pause in a file outside your own program file. Pressing the
![]() Continue button resumes running without changing the
results of the file.
Continue button resumes running without changing the
results of the file.
End Debugging Session
After you identify a problem, end the debugging session by going to the
Live Editor tab and clicking ![]() Stop. To avoid confusion, make sure to end your debugging
session every time you are done debugging. The Live Editor automatically ends the
debugging session when you save.
Stop. To avoid confusion, make sure to end your debugging
session every time you are done debugging. The Live Editor automatically ends the
debugging session when you save.
Step Into Functions
While debugging, you can step into called files, pausing at points where you want
to examine values. To step into a file, click the ![]() button directly to the left of the function you
want to step into. You also can use the F11 key to step into a
function. The Live Editor only displays the button if the line contains a call to
another function.
button directly to the left of the function you
want to step into. You also can use the F11 key to step into a
function. The Live Editor only displays the button if the line contains a call to
another function.
By default, the ![]() button only shows for user-defined functions and
scripts. To show the button for MathWorks® functions as well, on the Home tab, in the
Environment section, click
Preferences. Then, select MATLAB > Editor/Debugger, and in the Debugging in the Live Editor section,
clear Only show Step in button for user-defined
functions.
button only shows for user-defined functions and
scripts. To show the button for MathWorks® functions as well, on the Home tab, in the
Environment section, click
Preferences. Then, select MATLAB > Editor/Debugger, and in the Debugging in the Live Editor section,
clear Only show Step in button for user-defined
functions.
After stepping in, click the ![]() button at the top of the file to run the rest of
the called function, leave the called function, and then pause. You also can use
Shift+F11 to step out of a function.
button at the top of the file to run the rest of
the called function, leave the called function, and then pause. You also can use
Shift+F11 to step out of a function.
You also can step in and out of functions by going to the Live
Editor tab, selecting ![]() Step and then selecting
Step and then selecting ![]() Step In or
Step In or ![]() Step Out. These buttons do not honor the Only show
Step in button for user-defined functions preference and always step
in and out of both user-defined and MathWorks functions.
Step Out. These buttons do not honor the Only show
Step in button for user-defined functions preference and always step
in and out of both user-defined and MathWorks functions.
Examine Variables in the Workspace
When you step into a called function or file, the Live Editor displays the list of the functions MATLAB executed before pausing at the current line. The list is shown at the top of the file and displays the functions in order, starting on the left with the first called script or function, and ending on the right with the current script or function in which MATLAB is paused. This list is called the function call stack.
![]()
For each function in the function call stack, there is a corresponding workspace. Workspaces contain variables that you create within MATLAB or import from data files or other programs. Variables that you assign through the Command Window or create using scripts belong to the base workspace. Variables that you create in a function belong to their own function workspace.
To examine a variable during debugging, you must first select its workspace. The selected function in the function call stack indicates the current workspace. To select or change the workspace, click the function in the function call stack. MATLAB opens the function in the Live Editor and changes the current workspace to the workspace of the function.
Once the workspace is selected, you can view the values of the variables in it using the Workspace browser or as a data tip in the Live Editor.
Add Breakpoints and Run
If there are lines of code in your file that you want to pause at every time you run, add breakpoints at those lines. To add a breakpoint in the Live Editor, click the gray area to the left on an executable line where you want to set the breakpoint. For example, click the area next to line 3 in this code to add a breakpoint at that line. You also can use the F12 key to set a breakpoint.

When you run the file, MATLAB pauses at the line of code indicated by the breakpoint.
Clear Breakpoints
When you close and reopen a file, breakpoints are saved.
To clear a breakpoint, right-click the breakpoint and select Clear Breakpoint from the context menu. You also can use the F12 key to clear the breakpoint.
To clear all breakpoints in the file, select Clear All in File. To clear all breakpoints in all files, select Clear All.
Breakpoints clear automatically when you end a MATLAB session.
Disable Breakpoints
You can disable selected breakpoints so that your program temporarily ignores them and runs uninterrupted. For example, you might disable a breakpoint after you identify and correct a problem.
To disable a breakpoint, right-click it and select Disable Breakpoint from the context menu. The breakpoint becomes gray to indicate that it is disabled.

To reenable a breakpoint, right-click it and select Enable Breakpoint. To enable or disable all breakpoints in the file, select Enable All Breakpoints in File or Disable All Breakpoints in File. These options are only available if there is at least one breakpoint to enable or disable.
Add Conditional Breakpoints
You can add a condition to a breakpoint that tells MATLAB when to pause at the specified line. To add a condition,
right-click the breakpoint and select Set/Modify
Condition. When the Editor dialog box opens, enter a condition
and click OK. A condition is any valid MATLAB expression that returns a logical scalar value. MATLAB evaluates the condition before running the line.
For example, suppose that you only want to pause in
plotRand.mlx if the random generated data contains a
0.
Add a breakpoint with the following condition at line 3:
any(r == 0)

When you run the file, MATLAB pauses at the specified line when the condition is met. For
example, in the plotRand example, MATLAB pauses before running line 3 if any of the values in
r are equal to 0.
Add Breakpoints in Anonymous Functions
You can add multiple breakpoints in a line of MATLAB code that contains anonymous functions. You can set a breakpoint for the line itself and for each anonymous function in the line.
To add a breakpoint, click the gray area to the left on an executable line to add a breakpoint for the line. MATLAB adds a breakpoint for the line, and a disabled breakpoint for each anonymous function in the line. To enable a breakpoint for an anonymous function, right-click it and select Enable Breakpoint.
To view information about all the breakpoints on a line, hover your pointer on the breakpoint icon. A tooltip appears with available information. For example, in this code, line 5 contains two anonymous functions, with a breakpoint at each one.
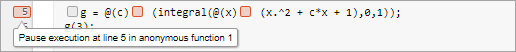
When you set a breakpoint in an anonymous function, MATLAB pauses when the anonymous function is called. The line highlighted
in green is where the code defines the anonymous function. The line highlighted
in gray is where the code calls the anonymous functions. For example, in this
code, MATLAB pauses the program at a breakpoint set for the anonymous function
g, defined at line 5, and called at line 6.
![]()