Finding Code Bottlenecks
Use the Profiler to determine which functions contribute the most time to execution time. You can make performance improvements by reducing the execution times of your algorithms and calculations wherever possible.
Once you have optimized your code, use the following techniques to reduce the overhead of object creation and updating the display.
For example, suppose you are plotting 10-by-1000 element arrays using the
myPlot function:
function myPlot
   x = rand(10,1000);
   y = rand(10,1000);
   plot(x,y,'LineStyle','none','Marker','o','Color','b');
end
profile on
myPlot
profile viewer
When you profile this code, you see that most time is spent in the
myPlot function:
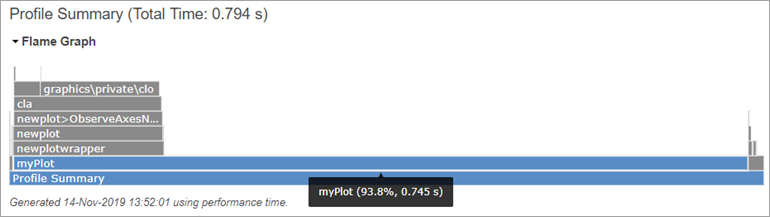
Because the x and y arrays contain 1000 columns of data, the plot function creates 1000 line objects. In this case, you can achieve the same results by creating one line with 10000 data points:
function myPlot
   x = rand(10,1000);
   y = rand(10,1000);
   % Pass x and y as 1-by-1000 vectors
   plot(x(:),y(:),'LineStyle','none','Marker','o','Color','b');
end
profile on
myPlot
profile viewer
Object creation time is a major factor in this case:
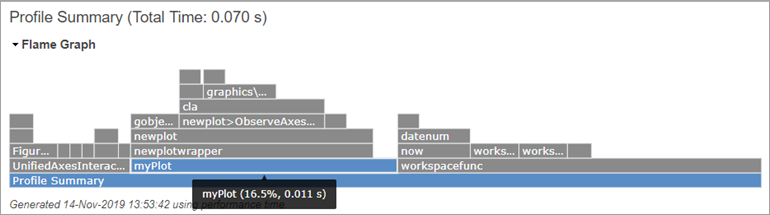
You can often achieve improvements in execution speed by understanding how to avoid or
minimize inherently slow operations. For information on how to improve performance using
this tool, see the documentation for the profile function.