Code Coverage Summary and Annotations
If you specify a code coverage tool for a SIL or PIL simulation, the software produces a code generation report that provides summary data and code annotations with coverage information. Each code annotation is associated with a code feature and indicates the nature of the feature coverage during code execution.
The code generation report also allows you to navigate easily between blocks in your model and the corresponding sections in the source code. You can also view coverage annotations and navigate to the corresponding model blocks in the Code view.
LDRA Testbed Coverage
The cumulative coverage data in a code generation report is derived from instrumented files associated with your latest top-model simulation and coverage data collected from simulations with other top models that share referenced models with your current top model.

The software provides LDRA Testbed® annotations in the code generation report and in the Code view to help you to review code coverage.
Note
Do not use the code generation report alone to verify that you have achieved your coverage goals. You must refer to the LDRA Testbed Report.
This example shows three kinds of annotations. On lines 134, 139, 140, and 141, the annotation ![]() indicates that statement coverage for each of
these lines of code is not complete.
indicates that statement coverage for each of
these lines of code is not complete.
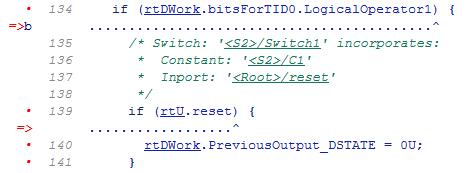
Placing the cursor over the annotation =>b produces a tooltip.
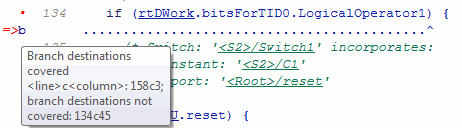
This tooltip indicates that only one branch destination is covered.
The code within the curly brackets, which starts at column 45 of line
134, is not executed. As the if statement on line
139 lies within this code, the corresponding annotation => states that the branch is not covered.
In the Code view, the color of each bar and annotations shows the amount of coverage of the corresponding line of code or code feature. Green indicates full coverage, yellow indicates partial coverage, and red indicates no coverage.

Place your cursor over the annotation ^b to see a tooltip. the tooltip indicates which branch destinations are covered and which are not covered.

This table describes the LDRA Testbed code annotations that you might see in a code generation report produced by a SIL and PIL simulations.
| Code feature | Annotation symbol | What happened during simulation |
|---|---|---|
| Function | Fcn | Function name returned through this
exit point. |
| => | Function name
never returned through this exit
point. | |
| Branch/condition | => | Condition not encountered. |
| =>t | Condition evaluated true only. | |
| =>f | Condition evaluated false only. | |
| tf | Condition evaluated both true and false. | |
| Branch/decision | => | Branch never encountered. |
| =>b | Branch to at least one destination covered and branch to at least one other destination not covered. | |
| b | Branch fully exercised. | |
| Modified Condition/Decision Coverage (MC/DC) | =>mc | Condition did not independently affect outcome of decision. |
| mc | Condition independently affected outcome of decision. | |
| Statement |
| Statements associated with line covered. |
|
| Not all statements associated with line covered. | |
|
Code that is reformatted by LDRA
Testbed and does not match the original source
code. For example, source code with For detailed coverage information, refer to the LDRA Testbed report. | =>Σ | Zero coverage — probes within source code line or files included by source code line not exercised. |
| =>Σ | Coverage probes within source code line or any included file partially exercised. | |
| Σ | Coverage probes within source code line or included files fully exercised. |
BullseyeCoverage Information
The cumulative coverage data in a code generation report is derived from instrumented files associated with your latest top-model simulation and coverage data collected from simulations with other top models that share referenced models with your current top model.

The software provides BullseyeCoverage annotations in the code generation report and in the Code view to help you to review code coverage.
This example shows two kinds of annotations. At line 41, TF indicates that the if decision
had both true and false outcomes during the simulation. At line 52, =>F indicates
that the if decision was false only during the
simulation.

In the Code view, the color of each bar and annotations shows the amount of coverage of the corresponding line of code or code feature. Green indicates full coverage, yellow indicates partial coverage, and red indicates no coverage.

This table describes the BullseyeCoverage code annotations that you might see in a code generation report produced by a SIL simulation.
| Code feature | Annotation symbol | What happened during simulation |
|---|---|---|
| Decision | => | Decision not executed. |
| TF | Decision evaluated both true and false. | |
| =>T | Decision evaluated true only. | |
| =>F | Decision evaluated false only. | |
| Function | => | Function not called. |
| Fcn | Function called. | |
| Switch label | => | Switch command not used. |
| Sw | Switch command used. | |
| Constant | k | Decision or condition was constant, which did not allow any variation in coverage. |
| Condition | => | Condition not encountered. |
| tf | Condition evaluated both true and false. | |
| =>t | Condition evaluated true only. | |
| =>f | Condition evaluated false only. | |
| Try | => | Try block never completed. |
| Try | Try block covered. | |
| Catch | => | Catch block not covered. |
| Cat | Catch block covered. |