Code Generation Reports
MATLAB® Coder™ produces a code generation report that helps you to:
Debug code generation issues and verify that your MATLAB code is suitable for code generation.
View generated C/C++ code.
Trace between MATLAB source code and generated C/C++ code.
See how the code generator determines and propagates type information for variables and expressions in your MATLAB code.
Identify potential issues in the generated code.
Access additional reports available with Embedded Coder®.
Report Generation
When you enable report generation or when an error occurs, the code
generator produces a code generation report. To control production and opening of a code
generation report, use app settings, codegen options, or
configuration object properties.
In the MATLAB Coder app:
To generate a report, set Always create a report to
Yes.If you want the app to open the report for you, set Automatically launch a report if one is generated to
Yes.
At the command line, use codegen options:
To generate a report, use the
-reportoption.To generate and open a report, use the
-launchreportoption.
Alternatively, use configuration object properties:
To generate a report, set
GenerateReporttotrue.If you want
codegento open the report for you, setLaunchReporttotrue.
Report Location
The code generation report is named report.mldatx. It is located in the html subfolder of the code generation output folder. If you have MATLAB R2018a or later, you can open the report.mldatx file by double-clicking it.
Errors and Warnings
View code generation error, warning, and information messages on the All Messages tab. To highlight the source code for an error or warning, click the message. It is a best practice to address the first message because subsequent errors and warnings can be related to the first message.
View compilation and linking errors and warnings on the Build Logs tab. The code generator detects compilation warnings only for MEX output or if you use a supported compiler for other types of output. See Supported Compilers.
Files and Functions
The report lists MATLAB source functions and generated files. In the MATLAB Source pane, the Function List view organizes functions according to the containing file. To visualize functions according to the call structure, use the Call Tree view.
To view a function in the code pane of the report, click the function in the list. Clicking a function opens the file that contains the function. To edit the selected file in the MATLAB Editor, click Edit in MATLAB or click a line number in the code pane.
If you have Embedded Coder and generate the report with traceability enabled, to view the source code and generated code next to each other in the code pane, click Trace Code. You can interactively trace between the source code and the generated code. See Interactively Trace Between MATLAB Code and Generated C/C++ Code (Embedded Coder).
If you want to move the generated files for standalone code (library or executable) to another development environment, you can put them into a zip file by clicking Package Code.
Specialized Functions or Classes
When a function is called with different types of inputs or a class uses different types for its properties, the code generator produces specializations. In the MATLAB Source pane, numbered functions (or classes) indicate specializations. For example:
![]()
Functions List After Fixed-Point Conversion
If you convert floating-point MATLAB code to fixed-point MATLAB code, and then generate fixed-point C/C++ code, the MATLAB Source pane lists the original MATLAB functions and the fixed-point MATLAB functions. For example:
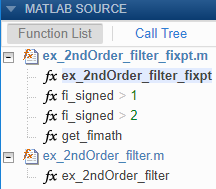
MATLAB Source
To view a MATLAB function in the code pane, click the function in the MATLAB Source pane. To see information about the type of a variable or expression, pause over the variable or expression.
In the code pane, syntax highlighting of MATLAB source code helps you to identify MATLAB syntax elements. Syntax highlighting also helps you to identify certain code generation attributes such as whether a function is extrinsic or whether an argument is constant.
Extrinsic Functions
In the MATLAB code, the report identifies an extrinsic function with purple text. The information window indicates that the function is extrinsic.

Constant Arguments
In the MATLAB code, orange text indicates a compile-time constant argument to an entry-point function or a specialized function. The information window includes the constant value.

Knowing the value of the constant arguments helps you to understand generated function signatures. It also helps you to see when code generation created function specializations for different constant argument values.
To export the value to a variable in the workspace, click ![]() .
.
MATLAB Variables
The Variables tab provides information about the variables for the selected MATLAB function. To select a function, click the function in the MATLAB Source pane.
The variables table shows:
Class, size, and complexity
Properties of fixed-point types
Whether an array is sparse
Array layout
This information helps you to debug errors, such as type mismatch errors, and to understand how the code generator propagates types and represents data in the generated code.
Visual Indicators on the Variables Tab
This table describes symbols, badges, and other indicators in the variables table.
| Column in the Variables Table | Indicator | Description |
|---|---|---|
| Name | expander | Variable has elements or properties that you can see by clicking the expander. |
| Name | {:} | Heterogeneous cell array (all elements have the same properties) |
| Name | {n} | nth element of a heterogeneous cell array |
| Class | v > n | v is reused with a different class, size, and
complexity. The number n identifies each unique
reuse (a reuse with a unique set of properties). When you pause over
a renamed variable, the report highlights only the instances of this
variable that share the class, size, and complexity. See Reuse the Same Variable with Different Properties. |
| Size | :n | Variable-size dimension with an upper bound of n |
| Size | :? | Variable-size with no upper bound |
| Size | italics | Variable-size array whose dimensions do not change size during execution |
| Class | sparse prefix | Sparse array |
| Class | complex prefix | Complex number |
| Class |
| Fixed-point type To see the fixed-point properties, click the badge. |
Array Layout Indicators on the Variables Tab
This table describes the badges that indicate array layout in the variables table.
| Badge | Description |
|---|---|
| Row-major array layout. |
| Column-major array layout. |
| A mixture of row-major and column-major layouts. |
Tracing Code
You can trace between MATLAB source code and generated C/C++ code by using one of these methods:
Interactively visualize the mapping between the MATLAB code and the generated code. To access interactive tracing, in the report, click Trace Code.
The Trace Code button is enabled only if you have Embedded Coder and you enabled code traceability when you generated code. See Interactively Trace Between MATLAB Code and Generated C/C++ Code (Embedded Coder).
Include source code as comments in the generated C/C++ code.
In a comment, the code generator produces a tag that helps you find the corresponding MATLAB source code. If you have Embedded Coder, the tag is a link to the source code. See Tracing Generated C/C++ Code to MATLAB Source Code.
Code Insights
The code generator can detect and report issues that can potentially occur in the generated code. View the messages on the Code Insights tab. The issues include:
Potential differences between the behavior of the generated code and the behavior of the MATLAB code. The report includes potential differences messages only if you enabled potential differences reporting. See Potential Differences Reporting.
Potential data type issues in the generated code, such as single-precision and double-precision operations.
The report includes potential data type issues only if you have Embedded Coder and you enabled potential data type issues reporting. If you have Fixed-Point Designer™, the report also identifies expensive fixed-point operations. See Highlight Potential Data Type Issues in a Report (Embedded Coder).
Potential row-major issues. See Code Design for Row-Major Array Layout.
Additional Reports
The Summary tab can have links to these additional reports:
Static code metrics report (requires Embedded Coder). See Generating a Static Code Metrics Report for Code Generated from MATLAB Code (Embedded Coder).
Code replacements report (requires Embedded Coder). See Verify Code Replacement Library (Embedded Coder).
Fixed-point conversion report (requires Fixed-Point Designer). See Convert MATLAB Code to Fixed-Point C Code.
Report Limitations
The entry-point summary shows individual elements of
varaginandvargout, but the variables table does not show them.The report does not show full information for unrolled loops. It displays data types of one arbitrary iteration.
The report does not show information about dead code.
Related Topics
- Generating a Static Code Metrics Report for Code Generated from MATLAB Code (Embedded Coder)
- Interactively Trace Between MATLAB Code and Generated C/C++ Code (Embedded Coder)
- Tracing Generated C/C++ Code to MATLAB Source Code
- Convert MATLAB Code to Fixed-Point C Code
- Row-Major and Column-Major Array Layouts
- Basic HDL Code Generation and FPGA Synthesis from MATLAB (HDL Coder)
- Generate HDL Code from MATLAB Code Using the Command Line Interface (HDL Coder)