seqdotplot
Create dot plot of two sequences
Syntax
seqdotplot(Seq1, Seq2)

seqdotplot(Seq1,Seq2, Window, Number)

Matches = seqdotplot(...)

[Matches, Matrix] = seqdotplot(...)
Arguments
Seq1, Seq2 | Nucleotide or amino acid sequences. Enter a character vector or string for each sequence. Do
not enter a vector of integers. You can also enter
a structure with the field
Sequence. |
Window | Enter an integer for the size of a window. |
Number | Enter an integer for the number of characters within the window that match. |
Description
seqdotplot( plots
a figure that visualizes the match between two sequences.Seq1, Seq2)
seqdotplot( plots
sequence matches when there are at least Seq1,Seq2, Window, Number)NumberWindow
When plotting nucleotide sequences, start with a Window of 11 and Number of 7.
Matches = seqdotplot(...)
[ returns
the dot plot as a sparse matrix.Matches, Matrix] = seqdotplot(...)
Examples
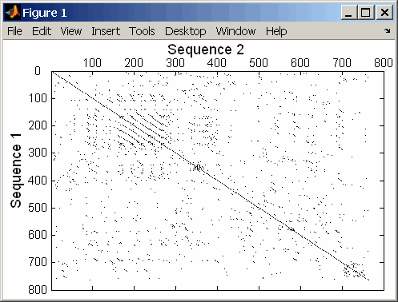
This example shows the similarities between the prion protein (PrP) nucleotide sequences of two ruminants, the moufflon and the golden takin.
moufflon = getgenbank('AB060288','Sequence',true);
takin = getgenbank('AB060290','Sequence',true);
seqdotplot(moufflon,takin,11,7)

Note
For the correct interpretation of a dot plot, your monitor's
display resolution must be able to contain the sequence lengths. If
the resolution is not adequate, seqdotplot resizes
the image and returns a warning.
Matches = seqdotplot(moufflon,takin,11,7)
Matches =
        5552

[Matches, Matrix] = seqdotplot(moufflon,takin,11,7)