simscape.logging.plotxy
Package: simscape.logging
Plot logged simulation data for one node or series against another
Syntax
h = simscape.logging.plotxy(x,y,Name,Value)
Description
h = simscape.logging.plotxy(x,y,Name,Value)y along
the y-axis, with series values of object x along
the x-axis. x and y are
objects (or homogeneous cell arrays of objects) of class simscape.logging.Series or simscape.logging.Node.
If x or y is a node, it
must be a simulation variable node (one that has a direct child series).
The values of this child series are then plotted along the respective
axis.
If x and y are cell
arrays, they must be of the same size, or one of them can be a scalar. x and y must
have the same time vectors. The remaining arguments are optional and
provided as name-value pairs.
h is a cell array of figure handles, one
for each y versus x plot
generated.
Input Arguments
|
An object of class |
|
An object of class |
Name-Value Pair Arguments
Specify optional
comma-separated pairs of Name,Value arguments. Name is
the argument name and Value is the corresponding value.
Name must appear inside quotes. You can specify several name and value
pair arguments in any order as
Name1,Value1,...,NameN,ValueN.
|
Plot data in the specified time range only. Provide a 1x2 vector Default: Plots all data. |
|
Adds the Default: Variable name. |
|
Adds the Default: Variable name. |
|
Plot the series values along the Default: Default unit of the series values. |
|
Plot the series values along the Default: Default unit of the series values. |
Output Arguments
|
A cell array of handles to the resulting plot figure windows. |
Examples
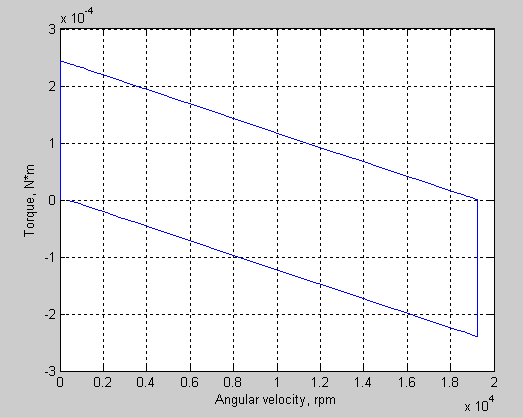
Plot the motor torque, in default units, against its angular
velocity, in rpm, and add axis names:
plotxy(simlog.Rotational_Electromechanical_Converter.R.w, simlog.Motor_Inertia_J.t, ...
   'xunit', 'rpm', 'xname', 'Angular velocity', 'yname', 'Torque')
